Published: 04-22-2026, 04:41 pm
Gold and silver market update — April 22, 2026
Key takeaways:
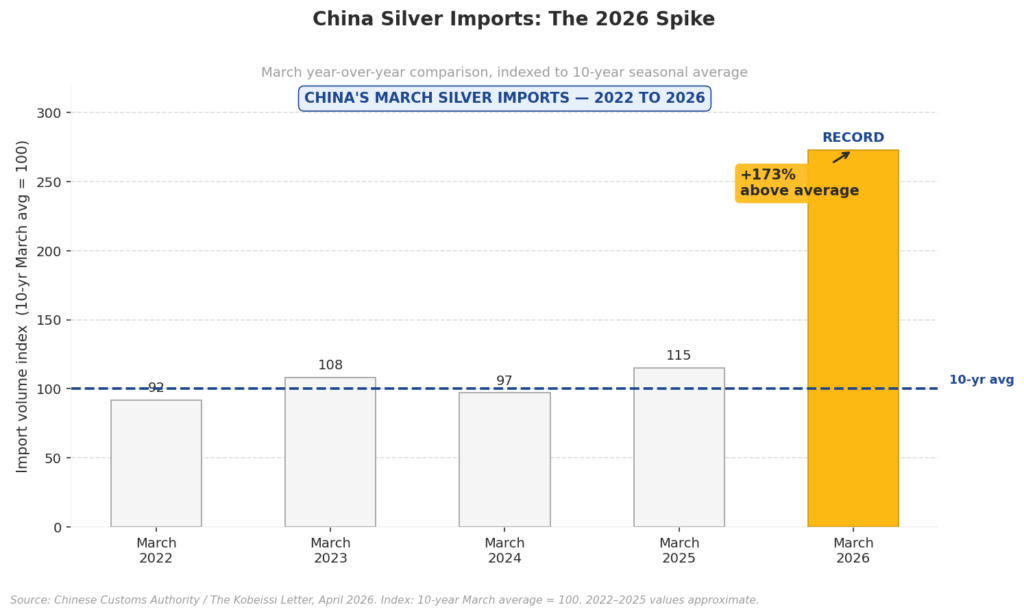
- China’s silver imports in March 2026 were 173% above the 10-year seasonal average — the highest on record per Chinese Customs Authority data
- Two unrelated forces drove it simultaneously: retail investors substituting silver for gold after gold neared $5,500/oz, and solar manufacturers racing to ship finished panels before China’s April 1 export tax rebate removal
- Strong physical demand and falling spot prices can coexist — Chinese buying sets a floor, not the price
China’s silver imports in March 2026 hit a record. They came in 173% above the 10-year seasonal average, according to Chinese Customs Authority data reported by Reuters. Year-to-date, China’s 2026 silver imports are the highest on record.
Two completely unrelated buyer groups drove that spike at the same time. Understanding both reveals something about silver’s demand position that a price chart alone won’t tell you.
Why Chinese Silver Imports Hit a Record in March 2026
Two forces converged in March 2026: retail investors buying silver bars as a cheaper alternative to gold, and solar manufacturers front-loading inventory before a regulatory deadline on April 1. One was monetary. The other was industrial. Neither group was responding to the same signal.
That combination pushed import volumes 173% above the March seasonal norm — well outside the range of normal monthly variation.
One month of elevated imports can be noise. A 173% deviation with two identifiable, unrelated causes is not.

The Edge Every Investor Needs Smarter precious metals investing starts here. The Nuggets Newsletter brings you essential market insights, Fed updates, global trends, educational videos, and much more.
Why Are Chinese Retail Investors Buying Silver Bars?
Gold reached nearly $5,500 per ounce in January 2026. That priced many individual savers out of the primary market.
In China, physical metal ownership is a mainstream savings habit — not a niche investor move. So when gold became too expensive, the response was straightforward: buy silver instead. If you believe in holding a physical store of value and the primary metal has run beyond your budget, you move to the secondary one.
This substitution pattern has appeared before. During the 2010–2011 gold run, silver outperformed gold by more than 2:1 as retail buyers shifted to the cheaper metal. The logic repeats because the behavior is stable: monetary demand doesn’t disappear when gold gets expensive. It redirects.
Why Did Solar Manufacturers Front-Load Silver Purchases?
On April 1, 2026, China removed export tax rebates on solar panels. That made finished panels more expensive to export — so manufacturers raced to complete and ship as much product as possible before the deadline hit.
Building more panels faster means consuming more silver. The global solar industry uses roughly 20% of total annual silver supply, according to the Silver Institute. When China’s solar base compresses months of production into weeks, that consumption spike shows up immediately in import data.
This had nothing to do with investment sentiment or monetary demand. It was a race against a calendar date. As a result, part of March’s industrial demand was borrowed from April and May — a timing shift, not a structural acceleration.
How Is Silver’s Demand Profile Different From Gold’s?
Gold is predominantly monetary. Platinum and palladium skew heavily industrial. Silver sits between them — exposed to two demand drivers that are almost entirely uncorrelated.
Investment demand for silver rises when monetary conditions weaken: inflation, negative real yields, currency debasement, loss of confidence in fiat. Industrial demand rises when clean energy deployment scales: solar buildouts, electronics manufacturing, EV production.
In March 2026, both fired simultaneously. The monetary investor was priced out of gold and moved to silver. The solar manufacturer was racing a deadline and pulled forward inventory. Neither knew about the other — but they both showed up in the same data, in the same month, pushing the same number to a record.
When these two drivers compound rather than cancel, the combined demand signal hits hard — especially in a market already running a structural supply deficit.
Does Strong Demand Explain Why Silver’s Price Still Fell?
Here’s the tension in this data: if Chinese silver demand was this strong in March, why did silver’s price fall roughly 15% from its January 2026 high by mid-April?
The answer lies in how silver is priced. Import data captures physical flows into China. It has no direct bearing on global spot pricing, which is set in COMEX and LBMA futures markets by a far broader set of participants. In Q1 2026, spot prices faced headwinds from a stronger U.S. dollar, hawkish Federal Reserve signals, and heavy profit-taking after January’s run.
Strong physical demand and falling spot prices coexist regularly in precious metals. Chinese buying doesn’t set the spot price — but it does set a floor. It limits how far physical supply can be drawn down before real scarcity starts to matter at the margin.
What Should Silver Investors Watch Next?
The March spike was partly a timing effect. April and May import volumes will likely pull back as the solar front-loading reverses. Watch China’s monthly releases — they arrive on a 4–6 week lag — to see whether retail investment demand holds the baseline elevated once the industrial distortion clears.
Supply context: the Silver Institute’s World Silver Survey 2026, released in April 2026, confirmed a sixth consecutive year of structural market deficit. That deficit doesn’t evaporate when a one-time demand event fades. The market still enters each surge from a position of constrained inventory — which is what separates a spike worth watching from one that isn’t.
Two things to track: whether China’s retail silver demand holds after gold’s pullback, and whether the industrial demand baseline — outside the solar front-loading — continues running above prior-year levels.
Stay On Top of Gold & Silver Prices
Get important market alerts sent straight to your inbox.
SOURCES
1. Reuters — China Customs Authority Silver Import Data, March 2026
2. Silver Institute — World Silver Survey 2026
3. World Gold Council — Gold Price Data
4. LBMA — Precious Metal Historical Prices
By the GoldSilver Editorial Team — helping investors understand sound money since 2005. This article is for informational purposes only and does not constitute financial, investment, or tax advice. Always consult a qualified financial advisor before making investment decisions.
You May Also Like:
- What Drives Gold Prices? 5 Forces Investors Are Watching Now
- The Gold-Silver Ratio Signal: What Silver’s Lead Means
- Gold Drops to $4,681 — Iran Ceasefire Expires Today
- The Real Reason Gold Is Down During an Oil War
- What the Warsh Hearing Means for Gold Prices
- IMF Says Treasuries Aren’t Safe Anymore. Gold Noticed First.
- Gold Price After Ceasefire Violation: The Floor Has Moved
- Oil Crashed 11%. Gold Went Up. That Tells You Everything.