Gold has already done something remarkable in 2026. It hit a record high of $5,600 — a milestone that would have seemed extreme just a few years ago. But if two major forces continue on their current trajectories, some analysts believe the next stop could be $6,000 or higher.
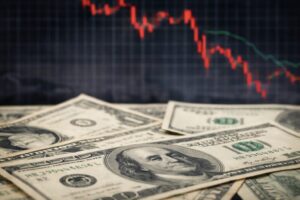
Those forces are a slowing U.S. economy and an escalating conflict in the Middle East. Separately, either one would be enough to support gold prices. Together, they’re creating a macro environment that gold has historically thrived in.
Here’s what the data shows — and what it could mean for your portfolio.
What Is the U.S. Economy Signaling Right Now?
The most important economic story right now isn’t inflation. It’s growth — or the lack of it.
According to data from the Bureau of Economic Analysis, real GDP grew just 0.16% in Q4 2025. Annualized, that works out to roughly 0.7% — barely above flat, and less than half the prior estimate of 1.4%.
U.S. Real GDP Growth — Quarterly, 2023–2025
Annualized percent change from prior quarter
This isn’t an isolated data point. Several other indicators are telling the same story:
The Conference Board Consumer Confidence Index has been trending lower in early 2026, with expectations for future conditions falling faster than present conditions — a pattern that has historically preceded recessions by 6–12 months.
Initial jobless claims have been creeping higher since Q4 2025, edging toward levels that have historically triggered concern among Fed economists about labor market deterioration.
The ISM Manufacturing PMI has remained in contraction territory (below 50) for several consecutive months — meaning the U.S. manufacturing sector has been shrinking, not growing. Sustained sub-50 readings are a classic leading indicator of broader economic weakness.
Taken together, these signals suggest the U.S. economy may be on the edge of a recession in 2026. That matters for gold because recessions historically trigger a flight to safety. When investors expect corporate earnings to weaken and financial stress to rise, gold tends to outperform.
The Financial System Isn’t Safer — And You Know It As risks mount, see why gold and silver are projected to keep shining in 2026 and beyond.
Could the Iran Conflict Push Inflation Higher?
At the same moment the domestic economy is slowing, a second threat is emerging from the other side of the world.
Rising U.S.-Iran tensions have put energy markets on edge. Military strikes and threats to shipping routes near the Strait of Hormuz — through which roughly 20% of the world’s traded oil passes — have pushed crude prices sharply higher. WTI crude is currently trading near $97 per barrel.
That’s a number with historical precedent. When Russia invaded Ukraine in February 2022, oil prices surged to $115 per barrel. That energy shock drove headline CPI to nearly 9% by mid-2022.
The inflation picture today looks calmer on the surface. According to the Bureau of Labor Statistics, headline CPI came in at 2.4% over the last 12 months — but core CPI, which strips out food and energy, was slightly higher at 2.5%. That gap matters: when core runs above headline, it suggests underlying price pressure may be stronger than the top-line number implies.
If oil remains elevated due to Middle East disruptions, the next CPI readings could come in meaningfully higher — and the Fed would face an increasingly difficult balancing act.
What Is Stagflation — and Why Is It Good for Gold?
Slow growth. Rising energy prices. Potential inflation rebound.
That combination has a name: stagflation. And it’s arguably the single most favorable macro environment for gold.
Stagflation is the scenario central banks dread most. When growth is weak, the instinct is to cut interest rates to stimulate the economy. But when inflation is high, rate cuts risk making prices worse. The Fed ends up paralyzed — unable to fight both problems at once.
In stagflationary environments, traditional assets like stocks and bonds tend to underperform. Gold, which preserves purchasing power when both growth and currencies are under pressure, has historically surged.
The 1970s are the most cited example. From 1971 to 1980, as energy shocks drove stagflation across the Western world, gold rose from around $35 per ounce to over $800 — a gain of more than 2,000%. Mike Maloney and Alan Hibbard have drawn direct parallels between that cycle and where gold stands today.
We’re not in the 1970s. But the conditions rhyme.
What Do the Charts Say About Gold’s Next Move?
The technical case for gold is reinforcing the macro picture, not contradicting it.
Gold broke above a major long-term resistance level at $2,075 in 2024 — the neckline of a massive cup-and-handle pattern that had been forming since 2011. That breakout unleashed a powerful rally, with prices running to $2,800, then $4,380, and ultimately to the recent high of $5,600.
Gold is currently pulling back from that high. The key support levels to watch on the downside:
- $5,000 — the first major floor within the current uptrend. Psychologically and technically significant.
- $4,800 — the lower boundary of the ascending broadening wedge pattern. A move here would be notable but not trend-breaking.
- $4,400 — deeper support dating back to the October 2025 breakout. A breach here would signal a more significant correction is underway.
As long as those levels hold, the technical structure points toward higher prices. The $6,000–$6,500 range is the target most frequently cited by gold bulls, supported by both the macro environment and the continuation of the long-term uptrend.
One caution worth noting: the RSI — a momentum indicator that measures whether a market is overbought or oversold — has reached elevated levels not seen since 1973, 1980, and 2008. In each of those periods, gold produced a significant correction before resuming its uptrend. The bull market isn’t over. But the path to $6,000 is unlikely to be a straight line.
Is Dollar Weakness Good for Gold?
Gold and the U.S. Dollar Index typically move in opposite directions. When the dollar strengthens, gold faces headwinds. When the dollar weakens, gold gets a tailwind.
The Dollar Index recently fell to a key support level near 96 — the lower edge of a long-term ascending channel. It’s now rebounding toward resistance around 100.50. If that rebound holds, it could put short-term pressure on gold.
But if the dollar breaks below 96 — which would happen in a scenario where U.S. recession fears intensify and investors rotate out of dollar assets — the next target would be around 90. Historically, dollar weakness of that magnitude has corresponded with major gold rallies.
The current U.S.-Iran conflict has introduced an unusual wrinkle: geopolitical fear is generating short-term safe-haven demand for both gold and the dollar simultaneously. That dynamic is unlikely to persist. If the conflict escalates or U.S. economic data deteriorates further, the dollar’s safe-haven appeal may fade while gold’s strengthens.
Should I Buy Gold Now?
Gold above $5,000 is unfamiliar territory for most investors. At these prices, the question shifts from “should I own gold?” to “how much, and in what form?”
A few things worth keeping in mind:
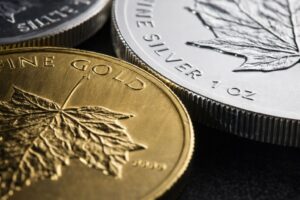
Physical gold holds value independent of counterparty risk. Paper gold — ETFs, futures contracts, allocated accounts held at third parties — carries risks that become more relevant in economic stress scenarios. If recession fears materialize, owning physical metal means you’re not dependent on anyone else’s solvency.
Corrections are normal, even in strong bull markets. The RSI signals and current technical consolidation suggest gold may not charge straight to $6,000. Pullbacks to the $4,800–$5,000 range, if they occur, have historically attracted buyers in this cycle.
The macro drivers aren’t going away. Recession risk, energy price inflation, Middle East instability, and U.S. dollar weakness are structural stories that take months or years to resolve. Gold’s role as a safe haven isn’t a short-term trade — it’s a response to a sustained shift in the macro environment.
As long as GDP growth stays weak, oil prices stay elevated, and geopolitical uncertainty persists, the fundamental case for gold remains intact.
Investing in Physical Metals Made Easy

People Also Ask
Why is gold rising in 2026?
Gold has been rising due to a combination of slowing U.S. economic growth, escalating Middle East tensions, and rising oil prices. These factors increase demand for safe-haven assets and raise concerns about stagflation.
What is the gold price forecast for 2026?
Some analysts project gold could reach $6,000 to $6,500 in 2026, supported by recession risks, inflation pressures, and continued geopolitical uncertainty. Key support levels to watch are $5,000 and $4,800.
How does a recession affect gold prices?
Recessions typically increase demand for gold as investors seek safe-haven assets. When economic growth slows, corporate earnings weaken, and financial stress rises, gold tends to outperform traditional assets like stocks and bonds.
How do Middle East tensions affect gold?
Conflicts in the Middle East — particularly those threatening oil supply routes — raise energy prices and inflation risks. Higher inflation and economic uncertainty both support gold as a store of value.
Should I buy physical gold or a gold ETF?
Physical gold eliminates counterparty risk, meaning your wealth isn’t dependent on the solvency of a financial institution. In periods of economic stress, that distinction matters. Gold ETFs offer easier access but carry risks that physical ownership does not.
This article is for informational purposes only and does not constitute financial or investment advice. Past performance is not indicative of future results. Consult a qualified financial advisor before making investment decisions.