Published: 06-26-2026, 09:35 am
Key Takeaways
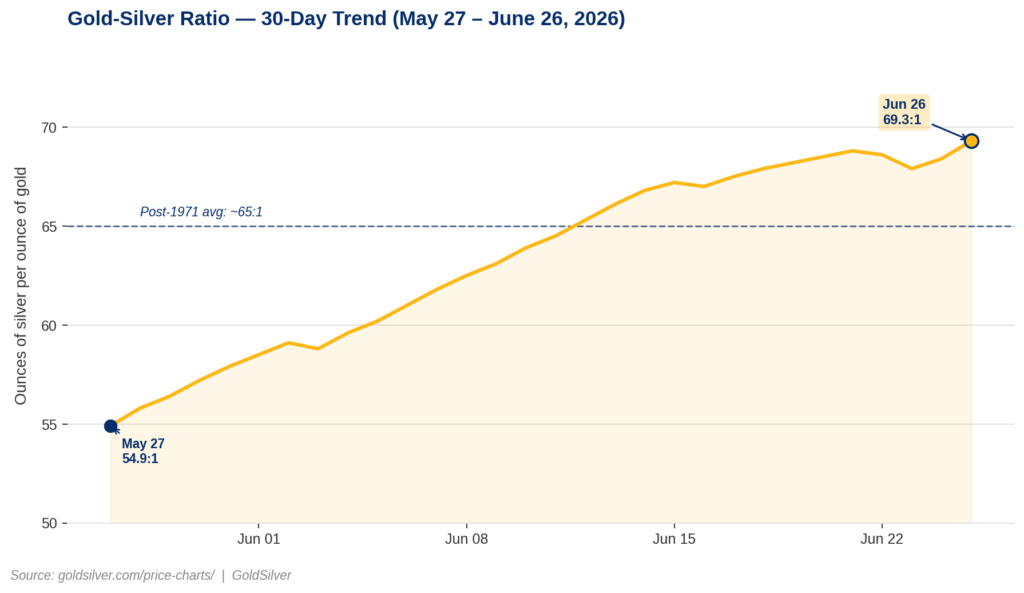
- The gold silver ratio closed Friday at 69.3:1 — its highest weekly close since the Iran war peak weeks, driven by the Fed’s hawkish June 17 FOMC repricing that pushed September rate-hike odds from 29% to approximately 68% in a single week.
- Thursday’s PCE data (headline 0.4% MoM, in line with forecasts; core 0.3% MoM as expected; YoY headline 4.1%) trimmed September rate-hike odds back to ~63%, triggering gold’s bounce above $4,000 and a fractional ratio compression — the first data signal pointing toward a regime shift.
- The gold silver ratio is a regime diagnostic, not a price forecast. At 69.3, it signals that rate-hike fear is the dominant force — not silver’s supply or industrial fundamentals, which remain structurally intact through a sixth consecutive annual supply deficit.
The gold silver ratio measures how many ounces of silver it takes to buy one ounce of gold. It closed Friday at 69.3:1 — its highest weekly close since the early weeks of the US-Iran conflict. Narrowing by 1 point required 14 ounces of silver when the US-China tariff truce compressed it to 54.9 in late May. Three weeks of the most hawkish Federal Reserve repricing of 2026 pushed it back to 69. That asymmetry is the story.
Gold is trading near $4,044 today (+0.44%) and silver at $58.34 (+0.82%), per goldsilver.com/price-charts/ as of June 26, 2026. Both metals are down sharply for the week as rate-hike expectations dominated paper market pricing.
What the Ratio Is Telling You
The gold silver ratio is the price of one ounce of gold divided by the price of one ounce of silver. At 69.3, it takes 69.3 ounces of silver to buy one ounce of gold. The higher the ratio, the cheaper silver is relative to gold.
Since the gold standard ended in 1971, this ratio has averaged approximately 65:1. It hit 127:1 during the COVID panic of March 2020 — an all-time high, per the Silver Institute. That extreme compressed to 54.9 when the US-China tariff truce ignited industrial demand expectations in late May 2026. Today’s 69.3 sits above the long-run average. More specifically, it sits at a level historically associated with rate-hike dominance — where that force is pricing silver, and where it is about to exhaust itself.

The Edge Every Investor Needs Smarter precious metals investing starts here. The Nuggets Newsletter brings you essential market insights, Fed updates, global trends, educational videos, and much more.
Why Did the Gold Silver Ratio Widen to 69:1?
Silver runs on two pricing engines simultaneously. The monetary engine — driven by real yields, inflation expectations, and dollar direction — moves alongside gold. Its industrial engine — solar panels, EV components, AI data center infrastructure, semiconductors — follows manufacturing cycles, not central bank policy.
The Federal Reserve’s June 17 FOMC meeting was Chair Kevin Warsh’s first. Nine of eighteen policymakers projected at least one rate hike before year-end in the Summary of Economic Projections. That hawkish shift activated silver’s monetary engine in reverse. Specifically, higher expected rates mean higher real yields, which increase the opportunity cost of holding non-yielding assets like silver. The US Dollar Index strengthened to a 13-month high. Both metals sold off — but silver fell harder than gold, widening the ratio from roughly 62 to 69 in eight trading days.
What the Data Is Missing
The May PCE inflation data — released Thursday — was collected entirely before the Iran-US peace roadmap began unwinding oil prices. Any deflationary benefit flowing from the ceasefire will not appear in official inflation data until the June PCE release in late July 2026. In other words, the Federal Reserve is tightening its forward guidance based on a rearview mirror.
Thursday’s PCE print partly confirmed this. Headline PCE came in at 0.4% month-over-month, matching April’s pace and broadly in line with forecasts. Year-over-year PCE hit 4.1% — the highest reading since April 2023, per the Bureau of Economic Analysis (June 25, 2026). Core PCE held at 0.3% month-over-month, in line with expectations. The annual rate ticked up to 3.4% — the highest since October 2023, per the Bureau of Economic Analysis. As a result, September rate-hike probability fell from approximately 68% to 63%, according to the CME FedWatch Tool. Gold bounced from near $3,950 back above $4,000, per goldsilver.com/price-charts/. Still, the ratio compressed fractionally. That compression — minor as it is — is the first data signal pointing toward a regime shift.
What History Says Happens Next
Importantly, the gold silver ratio does not forecast price levels. What it does is signal when one metal is historically cheap relative to the other. At 69:1, silver’s monetary engine is suppressed. Its industrial engine is running at reduced speed due to macro caution. When monetary headwinds ease — as they do at every rate cycle terminal phase — both engines receive a tailwind simultaneously.
As a result, that dual-engine recovery is silver’s structural advantage over gold. Gold operates primarily on a monetary engine. Silver, when the Fed narrative shifts, gets amplified by industrial demand simultaneously. The tariff-truce episode in late May 2026 demonstrated this with unusual clarity: the ratio compressed from roughly 67 to 54.9 in eleven trading days as industrial demand expectations surged alongside monetary re-pricing. From the current setup, that same math runs in reverse.
Is the Silver Supply Deficit Still Intact?
Silver’s supply deficit is now in its sixth consecutive annual year. Solar photovoltaic manufacturers reduced silver intensity by approximately 19% in 2026. Even so, the deficit widened — mine supply is contracting faster than industrial demand is falling, according to the Silver Institute’s World Silver Survey 2026 (Metals Focus, April 2026). Six straight years of drawing down above-ground stockpiles by a cumulative 762.1 million troy ounces — the Silver Institute’s exact figure. That is not a quarterly story. Indeed, it is a structural reality that does not change with the Federal Reserve’s September dot plot.
Goldman Sachs analysts Lina Thomas and Daan Struyven cut the bank’s year-end 2026 gold target from $5,400 to $4,900 on June 19. They cited the removal of all 2026 rate cuts from Goldman’s forecast. J.P. Morgan Global Research kept its $6,000 Q4 target unchanged. At current gold prices, Goldman’s $4,900 target implies 21% upside and J.P. Morgan’s $6,000 target implies 48%.
What to Watch
The next material data point for the gold silver ratio is the June PCE release, scheduled by the Bureau of Economic Analysis for July 30, 2026. It will be the first print to capture oil prices after the Iran ceasefire. If it shows the deflationary pipeline working, rate-hike odds for September will reprice sharply lower, and silver’s monetary engine will begin to recover. Specifically, a ratio compression from 69 back toward 60 implies silver outperforming gold by roughly 13 percentage points, assuming gold’s price holds.
The gold silver ratio is not a buy signal. It is a diagnostic. At 69.3:1 on a Friday close, it is diagnosing a market in which rate-hike fear has temporarily priced out silver’s dual-engine recovery potential. Yet the fundamentals — six-year deficit, industrial demand from the energy transition, historically wide mining margins — have not changed. Only the paper market’s narrative has.
That is not a loss. This is a setup.
Stay On Top of Gold & Silver Prices
Get important market alerts sent straight to your inbox.
SOURCES
1. Federal Reserve — Summary of Economic Projections, June 17, 2026
2. Bureau of Economic Analysis — Personal Consumption Expenditures Price Index, May 2026
3. CME Group — FedWatch Tool, June 26, 2026
4. GoldSilver — Live Gold and Silver Price Charts
5. Silver Institute — World Silver Survey 2026
6. Goldman Sachs Global Investment Research — Gold Price Forecast Revision, June 19, 2026
7. J.P. Morgan Global Research — Gold Price Outlook 2026
Disclaimer: This article is for informational purposes only and does not constitute financial or investment advice. Always consult a qualified financial adviser before making investment decisions.
You May Also like:
- Q1 GDP Beat. Jobless Claims Beat. Gold Rose. Here’s Why.
- PCE Hit 4.1%. Gold Went Up. Here’s Why.
- 298 Tonnes of ETF Gold Is Underwater. Central Banks Aren’t.
- Hawkish Fed, Gold Below $4,000, Silver Below $60 — and a Market That Disagrees.
- Gold Just Broke $4,000. The Mainstream Called the Debasement Trade Dead. They’re Wrong.
- Two Things Are Hitting Gold Simultaneously. Only One Is About Gold.
- Why Is Silver Down 5%? The Gold-Silver Ratio Explains.