Published: 05-04-2026, 09:45 am | Updated: 05-04-2026, 11:00 am
Gold and silver market update — May 4, 2026
Key Takeaways
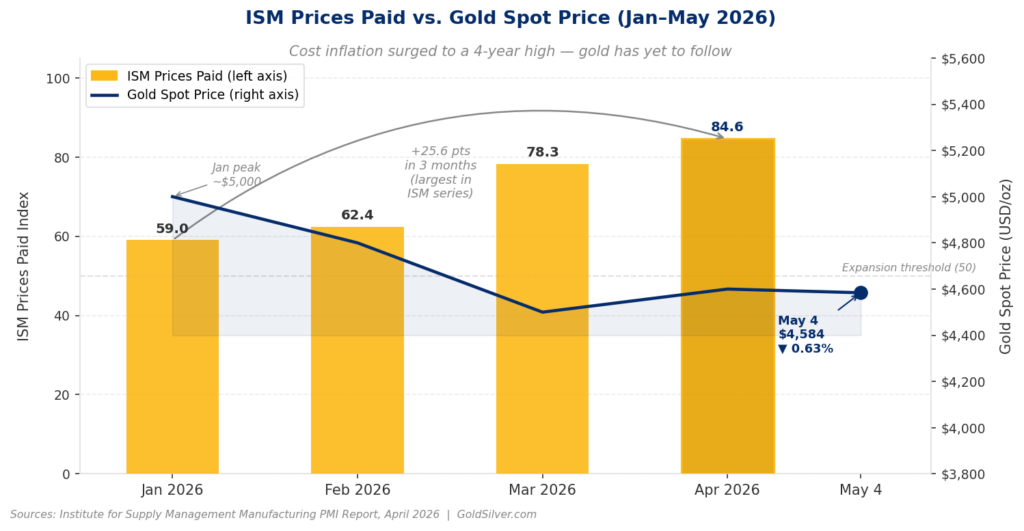
- The gold price fell 0.63% to $4,584 on May 4, 2026 despite a tanker strike in Hormuz and the worst ISM Prices Paid print since April 2022. The muted response signals the war premium is already absorbed — not that gold’s structural case has weakened.
- ISM Prices Paid hit 84.6 in April 2026 — a 25.6-point surge over three months, the largest in the ISM series — while the Employment Index fell to 46.4, its 2026 low. Stagflation is now confirmed in manufacturing data, not just forecasted.
- The Fed is structurally trapped. It cannot raise rates into a contracting labor market or cut rates into 84.6 Prices Paid and 3.5% PCE. Moreover, Goldman Sachs holds its year-end 2026 gold target at $5,400/oz, with the thesis that once this paralysis becomes consensus, real yields compress and gold re-accelerates.
Two Catalysts That Should Have Lifted the Gold Price — But Didn’t
This morning, a tanker was struck by projectiles in the Strait of Hormuz. That same day, U.S. manufacturers reported their worst cost-inflation reading in four years. Still, the gold price fell.
Gold is trading near $4,584 (as of May 4, 2026 ET), down 0.63% from Friday’s close. Silver is near $75, up roughly 1%.
Both catalysts arrived on the same Monday — and both should have sent gold higher. Here is what each one means.
The first: the Strait of Hormuz. A tanker was hit by projectiles in the waterway that carries roughly 20% of the world’s traded oil. Iran warned it would target U.S. forces entering the strait and told commercial vessels to coordinate with Tehran before moving. Now in its tenth week, the conflict has left the strait functionally closed.
The second: the ISM’s April Manufacturing Report on Business, released May 1, 2026. Its Prices Paid component — a real-time measure of input costs across U.S. manufacturing — came in at 84.6. That is up from 78.3 in March and the highest reading since April 2022. Furthermore, the three-month surge of 25.6 percentage points is the largest in the ISM series.
Meanwhile, the Employment Index fell to 46.4 — its lowest print of 2026. Output expanding. Costs exploding. Jobs contracting. That is stagflation — not as forecast, as fact.

The Edge Every Investor Needs Smarter precious metals investing starts here. The Nuggets Newsletter brings you essential market insights, Fed updates, global trends, educational videos, and much more.
Why Did the Gold Price Fall on the Worst News Day in Months?
Since the Iran conflict began on February 28, 2026, the gold price is down roughly 13%. Oil is up more than 50% over that same period. The reason those two facts coexist is the inflation spiral itself.
War drives oil higher. Oil then drives input costs higher. In turn, input costs drive consumer inflation higher. Consequently, inflation forces the Federal Reserve to hold — or raise — rates. Higher rates support real yields and the dollar. And a strong dollar with elevated real yields is a headwind for a non-yielding asset like gold. The war, in other words, became its own enemy.
Compounding this, the Federal Reserve’s preferred inflation gauge, the Personal Consumption Expenditures (PCE) index, stands at 3.5% as of March 2026 and is still rising. At its most recent Federal Open Market Committee (FOMC) meeting — Powell’s last as chair, April 29, 2026 — the Fed held rates at 3.50–3.75% and produced four dissents. That is the most divided Fed vote since 1992.
Kevin Warsh’s nomination has cleared the Senate Banking Committee, and a full Senate vote is expected the week of May 11. However, the paralysis predates the transition.
The ISM data shows why that paralysis persists. When companies pay record input costs and cannot hire, those costs reach consumers within one to three quarters. As a result, the official inflation gauges lag what manufacturers are already living. PCE at 3.5% is a rearview mirror. The pipeline is fuller than it looks.
Goldman Sachs is holding its year-end 2026 gold price target at $5,400 per ounce. Their logic: the moment markets accept the Fed won’t tighten enough to break this cycle, real yields compress and gold re-accelerates. That moment hasn’t arrived. Nevertheless, the ISM data just moved it closer.
What Does Gold’s Non-Reaction to the Hormuz Tanker Strike Actually Mean?
Gold barely moved today. A tanker was struck in Hormuz. Iran threatened U.S. forces directly. Yet the gold price fell 0.63%.
That is the signal.
In May 2019, U.S.–Iran tensions in this same waterway pushed gold up roughly 2% in a single session. Then, in February 2022, the day Russia entered Ukraine, gold gained 1.7% intraday. By contrast, when the current Iran conflict began on February 28, 2026, gold actually fell. The war’s inflation implications froze the Fed faster than they triggered safe-haven buying.
As a result, the war premium was priced in on day one. Today’s escalation added nothing to it. That isn’t weakness. It’s saturation.
What remains under the price — after both the war premium and the rate headwind are accounted for — is the ISM signal. A central bank that cannot raise rates with Prices Paid at 84.6 and payrolls contracting is not just cautious.
It is cornered. Each month it stays cornered, real yields compress a little more. With each passing month, the structural case for physical gold builds a little more quietly.
Gold doesn’t need a catalyst. It needs the calendar.
What’s the Bear Case for the Gold Price Right Now?
It is worth naming clearly: if PCE accelerates toward 4%, the Fed may be forced to hike. Real yields would jump. The dollar would strengthen. As a result, gold would face a genuine correction from current levels.
That risk exists. However, here is what limits it.
U.S. annual debt service already exceeds $1 trillion. Moreover, the federal deficit is running at approximately $1.9 trillion for fiscal year 2026. At those levels, aggressive rate hikes don’t just fight inflation — they destabilize the government’s own finances.
History is instructive here, though not directly comparable. Fed Chair Paul Volcker pushed the federal funds rate to nearly 20% in 1981. Even then, gold peaked at $850/oz in January 1980 only after years of that sustained pressure. Today’s debt load makes a Volcker-scale response structurally off the table. The bear case is real. Its ceiling on execution, however, is lower than it looks.
What to Watch: The May 8 Jobs Report and the Gold Price
The next test is Friday, May 8, 2026. The U.S. Bureau of Labor Statistics releases April nonfarm payrolls. Consensus sits at approximately 53,000 new jobs — against March’s 178,000.
Inflation is running hot. The labor market is rolling over. With no clean exit available, the Fed is cornered once again. That is not a forecast of what the gold price will do next week. It is, however, a precise description of the environment gold was built for.
Stay On Top of Gold & Silver Prices
Get important market alerts sent straight to your inbox.
SOURCES
1. Institute for Supply Management — Manufacturing PMI Report, April 2026
2. U.S. Bureau of Economic Analysis — Personal Income and Outlays, March 2026
3. Federal Reserve — FOMC Statement, April 29, 2026
4. Congressional Budget Office — Budget and Economic Outlook, February 2026
5. U.S. Energy Information Administration — The Strait of Hormuz Is the World’s Most Important Oil Transit Chokepoint
6. Goldman Sachs Commodity Research, May 2026 — available to institutional clients via Goldman Sachs Research portal
7. CME Group — Gold Futures & Options
8. U.S. Senate Committee on Banking, Housing, and Urban Affairs — Warsh Nomination, April 29, 2026
9. U.S. Bureau of Labor Statistics — Employment Situation Summary
Disclaimer: This article is for informational purposes only and does not constitute financial or investment advice. Always consult a qualified financial adviser before making investment decisions.
You May Also Like:
- Gold Is Up 41% From a Year Ago. The Fed Can’t Stop It
- 5 Economic Warning Signs Gold Investors Need to See Today
- WGC Q1 2026: What Asia Knows That Wall Street Doesn’t
- BEA Stripped Silver From GDP. Here’s What It Means
- PCE at 3.5%, GDP Miss: Why This Is Bullish for Gold
- How Warsh’s Inflation Measure Could Move the Gold Price
- Gold Is Down 19%. This $3.8B Bet Says It Doesn’t Matter
- Gold, Oil, and the Fed: Why the Old Rules Don’t Apply