Silver Rises Over 120% YTD


Published: 11-02-2026, 02:42 pm
Last verified November 2026.
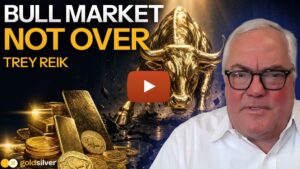
Michael Oliver, founder and chief analyst at Momentum Structural Analysis, joined Megan King Diaz on The GoldSilver Show. Gold has drifted for nine months. Oliver says the pattern looks a lot like 2008, and that break turned into a buying point. His full case sits in the interview below.
Key Takeaways:
- Gold has pulled back 29% so far. Oliver says 2008’s break was bigger, at 35%, and it ended in new highs.
- He has been bullish on gold and silver since a 2016 momentum signal, long before price confirmed it.
- Gold mining stocks trade near 8% of an ounce of gold. The average across the 1980s, 1990s and 2000s was 25%.
- He says large asset managers are buying blue-chip miners because their funds cannot hold bullion directly.
Is Gold’s Current Pullback Really Like 2008?
Yes, according to Oliver, and the comparison favors gold owners, not sellers. He tracks momentum first and price second. Momentum tends to turn before price does [Michael Oliver interview, October 23, 2026]. That method flagged the 2015 low near $1,050 an ounce. It flagged the next buy point at $1,140, well before most price-watchers called a bottom.
Since then, Oliver says nothing has broken the long-term uptrend. Gold fell from over $2,000 to about $1,600 in 2022. Many investors called that the end of the bull market. Oliver calls it an intermediate correction instead, because annual momentum never broke down.
The current slide is nine months old. Gold sits 29% below its January high. For comparison, the 2008 break ran deeper, at 35%. Even so, Oliver says today’s drop is not yet showing the signal that confirms a rejoin with the longer trend. He believes that signal is close.
The Knowledge That Changes Everything
Two essential guides — yours free. Understand why gold matters and why fiat currencies always fail.
What Actually Happened to Gold After the 2008 Crash?
Stocks crashed hard in October 2008. The S&P 500 fell about 17% for the month, its worst since 1987 [Bespoke Investment Group, October 2008]. Gold fell with them. Many investors assumed the two moves meant the same thing: trouble ahead for both. Oliver calls that assumption false, and the record backs him up.
Gold had already made new highs earlier in 2008, topping $1,000 for the first time, even while stocks were falling. Then came the October shakeout. The Federal Reserve answered one month later with its first round of quantitative easing. Stocks kept falling into March 2009. Gold did not. It turned back toward its highs and kept climbing.
Silver fell harder than gold in 2008, dropping about 56%. This time, its decline runs closer to 50%, still steeper than gold’s. Oliver says that gap is typical of silver’s bigger swings in both directions.
Oliver also flags something different about today. In 2008, the crisis sat inside private mortgage debt. Today, he points to government debt stress in Japan and Europe. That stress makes Treasury bonds a less certain shelter than they were 17 years ago. In his view, that shift is one more reason capital keeps finding its way into gold and silver.
Why Does One Analyst Favor Gold Miners Over Gold Itself?
Because, by his own measurement, miners are trading well below their historical worth relative to gold. Oliver tracks the XAU index, a basket of major gold and silver mining stocks. He divides it by the price of an ounce of gold. For decades, that ratio averaged around 25%. It collapsed to just 4% by the 2015 low.
Today the ratio sits near 8%. That is a real recovery, yet still far under the old multi-decade range. Oliver notes the ratio broke out of a 12-year sideways pattern late last year. It then pulled back without erasing that breakout. He expects the climb to continue toward the low end of its historical range. That path would mean a significant re-rating from here.
He also sees a specific buyer behind this move. Large institutional managers often cannot hold bullion or futures inside a stock-only fund. With Treasury bonds looking shakier, Oliver says those managers are rotating into blue-chip miners instead. He names Newmont and Wheaton Precious Metals, not smaller junior stocks. As evidence, he points to August’s rally. The major miners came close to their old highs, closer than gold or silver bullion did.
Could Silver Outrun Gold in the Next Leg Up?
Oliver thinks so, and his reasoning starts with a 50-year ceiling. Silver first neared $50 an ounce in 1980, then again in 2011 [Benzinga, January 21, 1980 market history]. It did not break through either time. This year, it finally cleared that level. It climbed to a record near $121 on January 29 [Silver Institute, January 2026]. It then crashed within a day, and kept sliding to about $64 within two weeks. Even after that drop, Oliver says silver is still trading above the old range’s top.
He also compares silver with other raw materials. Copper trades near six times its 1980 price today. Gold trades at more than four times its 1980 high. Silver, by contrast, sits barely above its own 1980 peak, despite years of production running behind industrial demand. Oliver calls this a “fact,” not a forecast. If silver simply matched those other metals since 1980, it would trade for several times its current price.
Why hasn’t it caught up already? Oliver points to years of market manipulation, now mostly unwound. He expects silver’s next move higher to come fast and with little resistance. In his view, bearish sentiment has already pushed out the sellers who would normally slow a rally. He stops short of naming a target. He explains exactly why in the full conversation.
What Does the Full Interview Reveal That This Article Doesn’t?
Plenty. Oliver walks through the exact signal he is watching for a long-term rejoin. He names the resistance level he expects the miner-to-gold ratio to test next. The math behind his money-supply comparison for silver gets a full explanation. So does why buyers chose Newmont and Wheaton over smaller names.
This conversation is part one of a two-part interview. Part two turns to the bond market, the Federal Reserve, growth tied to artificial intelligence, and the federal debt picture. Subscribe to The GoldSilver Show so you don’t miss it.
For more on that swing, see our report: silver fell below $50 and is falling faster than gold.
Stay On Top of Gold & Silver Prices
Get important market alerts sent straight to your inbox.
People Also Asked
Yes, in size and in what followed. Gold fell 35% in 2008 before resuming its climb. The current decline sits at 29%, smaller so far. Momentum analyst Michael Oliver says the structure matches 2008 closely. He expects a similar outcome once a specific signal confirms.
The Federal Reserve answered the 2008 crash with quantitative easing, its first large-scale bond-buying program, starting in November 2008. Stocks kept falling into early 2009. Gold did not follow. It returned to its prior high and then moved well beyond it over the following years.
By one common measure, yes. Dividing a basket of major miners by the price of gold shows a ratio near 8% today. The average across several earlier decades was 25%. Analyst Michael Oliver argues this gap could close as institutional buyers rotate into mining stocks instead of bonds.
Silver remains closer to its 1980 price than gold or copper are to theirs. That gap persists despite years of supply running below demand. Analyst Michael Oliver says that gap, plus weak current sentiment, sets up a sharper rally in silver.
Watch the Full Interview
Michael Oliver’s full conversation with Megan King Diaz covers his exact momentum signals and his miner-to-gold target. It also covers the reasoning he won’t put a number on silver. Watch the complete interview, and look for part two on bonds, the Fed and federal debt.
Watch the full interview with Michael Oliver on The GoldSilver Show
SOURCES
1. The GoldSilver Show – Michael Oliver, Momentum Structural Analysis, Part 1 – October 23, 2026
2. Benzinga – This Day In Market History: Silver Surges, Hits All-Time High In 1980
3. The Big Picture (Barry Ritholtz) – “Just How Bad Was October 2008?”, citing Bespoke Investment Group’s October 31, 2008 monthly performance data
4. Silver Price Forecast 2026, citing USGS and Silver Institute January 2026 price data ($121.15/oz all-time high, January 29, 2026)
5. GoldSilver – Silver Breaks Below $50. Why Is It Falling Faster Than Gold? – November 2, 2026
Disclaimer: This article is for informational purposes only and does not constitute investment advice. Past performance is not indicative of future results. Always consult a qualified financial advisor before making investment decisions.
You May Also Like:
- Gold Broke $4,000. The Fed Just Proved Him Right.
- Why Isn’t Gold at $6,000 Yet? Gerald Celente Explains
- Peter Grandich: What Happens to Gold When Stocks Fall?
- Peter Grandich Sold Gold, But He’s Buying On the Dip
- Ronnie Stoeferle’s $8,900 Gold Forecast Comes With a Warning
- US May be on Brink of Massive Gold Revaluation
- Why Gold Ignored the Fed’s Fastest Rate Hikes in 40 Years
- The $145 Trillion Market That Moves Gold More Than the Fed
- A 6% Yield Could Make or Break Gold’s Rally