 Silver Rises Over 120% YTD




Gold Jumped $90 This Morning. June CPI Just Explained Why.
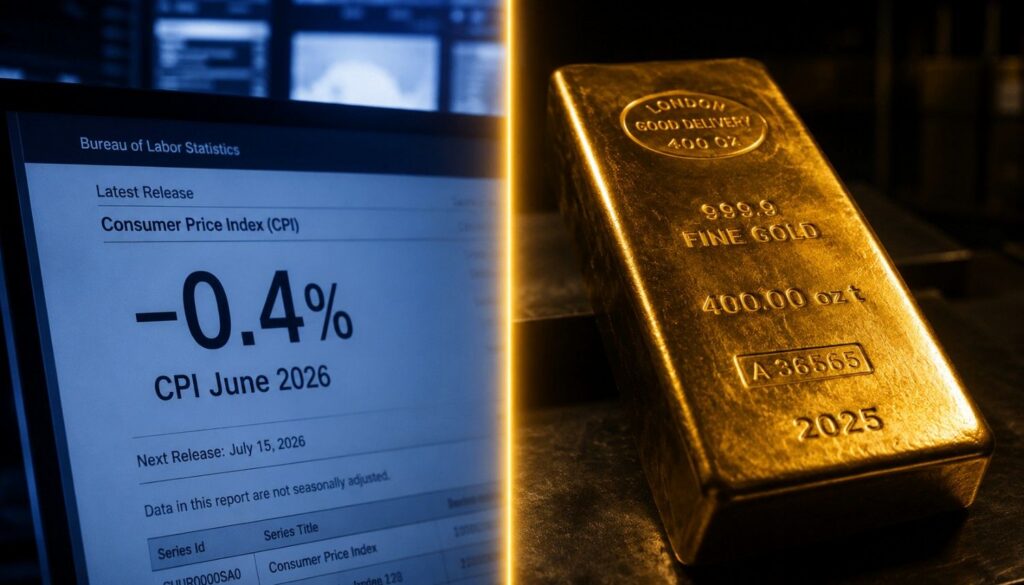
Gold jumped $90 and silver rose 3% after June CPI printed −0.4% — its largest monthly drop since April 2020. Here’s the real-yield mechanism behind the move, and why the headline relief is already reversing.
Trump Declared the Ceasefire Over. Gold Barely Moved.
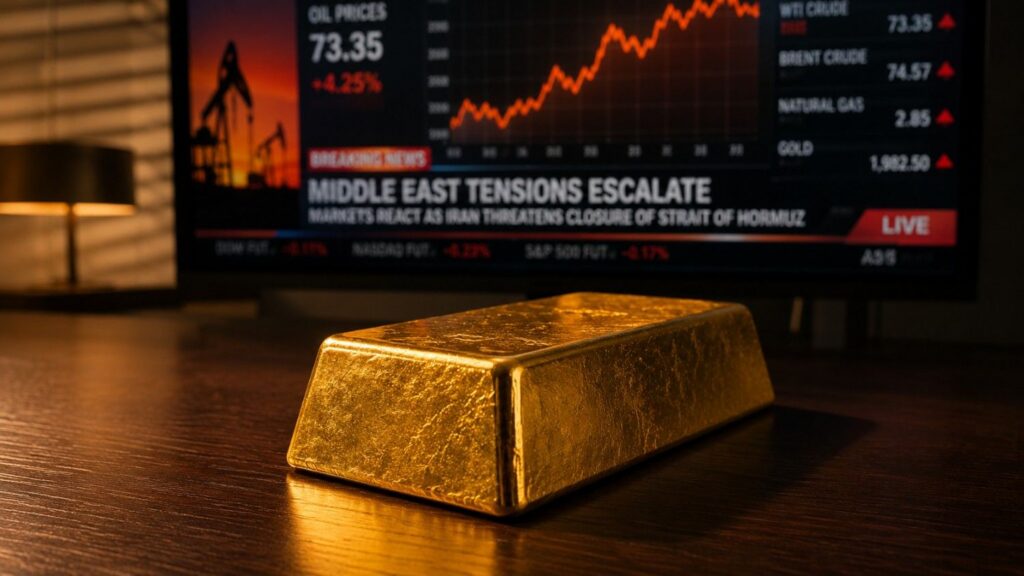
Trump declared the Iran ceasefire over on July 10. Gold fell 0.5%. Here is the mechanism that explains why geopolitical risk has been suppressing gold prices all year — and why Tuesday’s CPI print matters far more than any missile strike.
Five Days From Now, Two Numbers Will Decide Gold’s Second Half
Gold is trading at $4,134 today as two market-moving events converge on Monday, July 14. June CPI drops at 8:30 AM ET. Fed Chair Warsh testifies 90 minutes later. Here’s the exact mechanism connecting both to gold and silver prices — and three scenarios for what happens next.
China Just Bought Its Most Gold Since 2023. It Did It During the Quarter Gold Fell 16%.
The People’s Bank of China added 14.93 tonnes of gold in June 2026, its largest single-month purchase since 2023 and its 20th consecutive month of buying. It happened during gold’s worst quarterly decline in thirteen years. Here is why the world’s most sophisticated reserve managers keep buying regardless of what the price does.
Gold Hits 3-Week High as Fed Hike Odds Halve on Jobs Miss
June’s jobs report added just 57,000 positions — less than half the forecast. Fed rate hike odds for July 29 fell to 22%. Gold hit a 3-week high. Here’s the mechanism.
172,000 Jobs Doubled the Forecast. Thursday’s Report Could Move Gold Again.
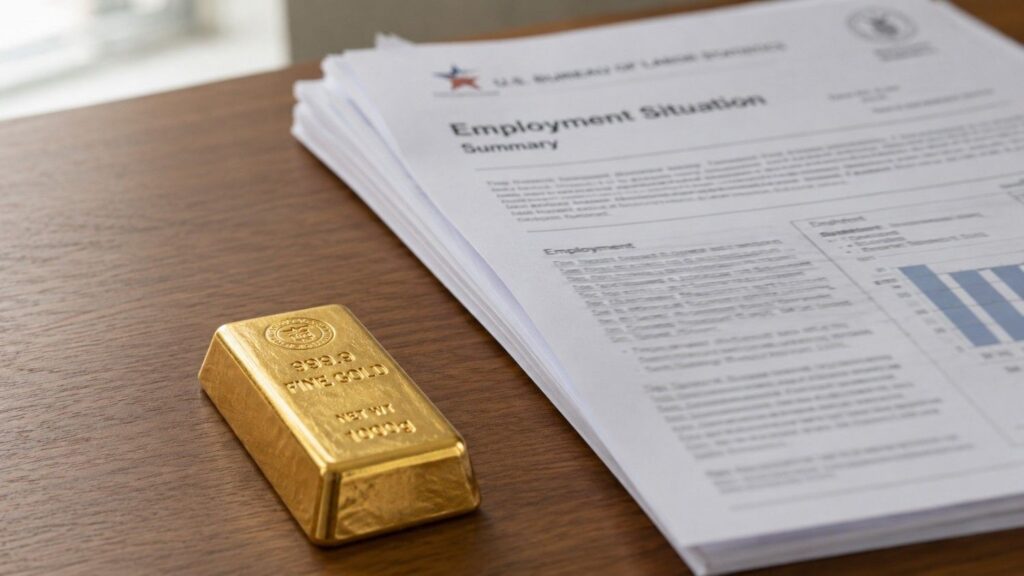
Every month, one government report moves gold’s paper price more than almost anything else. Thursday’s June jobs report is no different. Here’s the mechanism behind the move — and a three-scenario framework for what each outcome means for gold before 8:30 AM ET.
The Dot Plot Has 18 Dots. The Chair Withheld His.

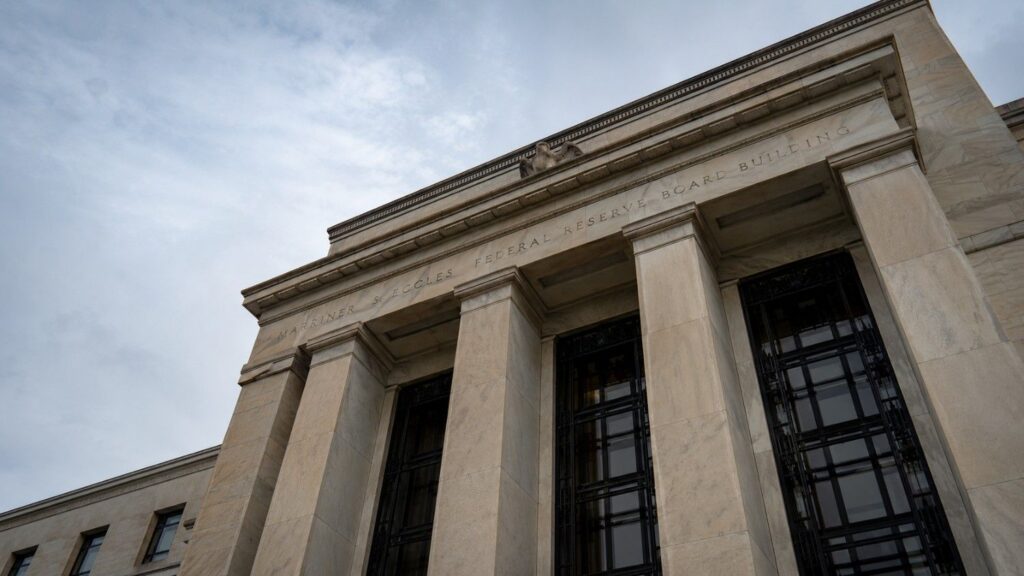
The Fed’s June dot plot had 18 projections, not 19. Chair Warsh withheld his. The split is 9-to-9 — not the hawkish mandate markets have priced into gold.
Silver Looks Like It’s Losing. The Ratio Says It’s Loading.
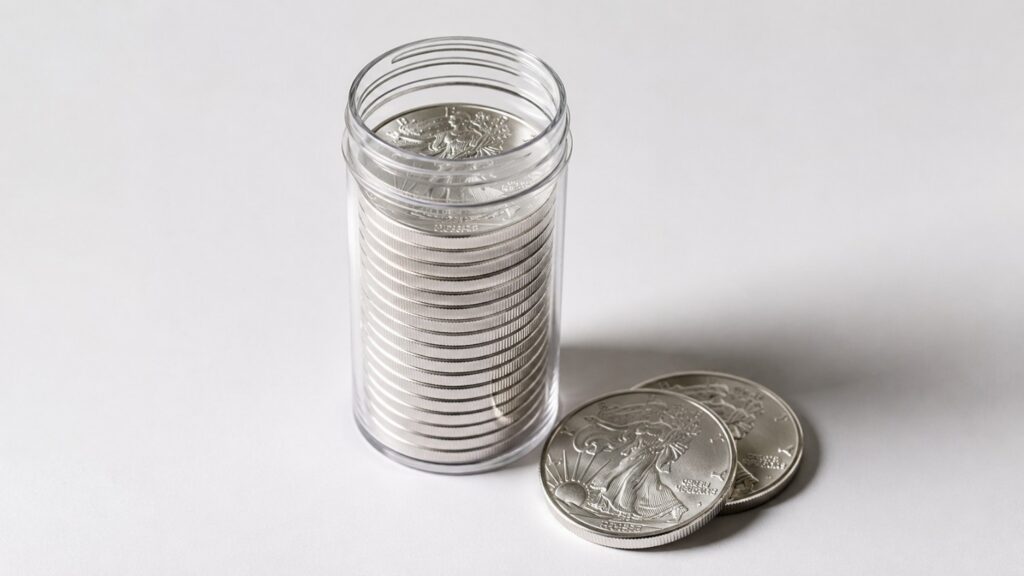
The gold-silver ratio just closed the week at 69.3:1 — near its highest level since the Iran war peak. The mechanism behind it is temporary. The setup it creates is not.
Why Is Silver Down 5%? The Gold-Silver Ratio Explains.
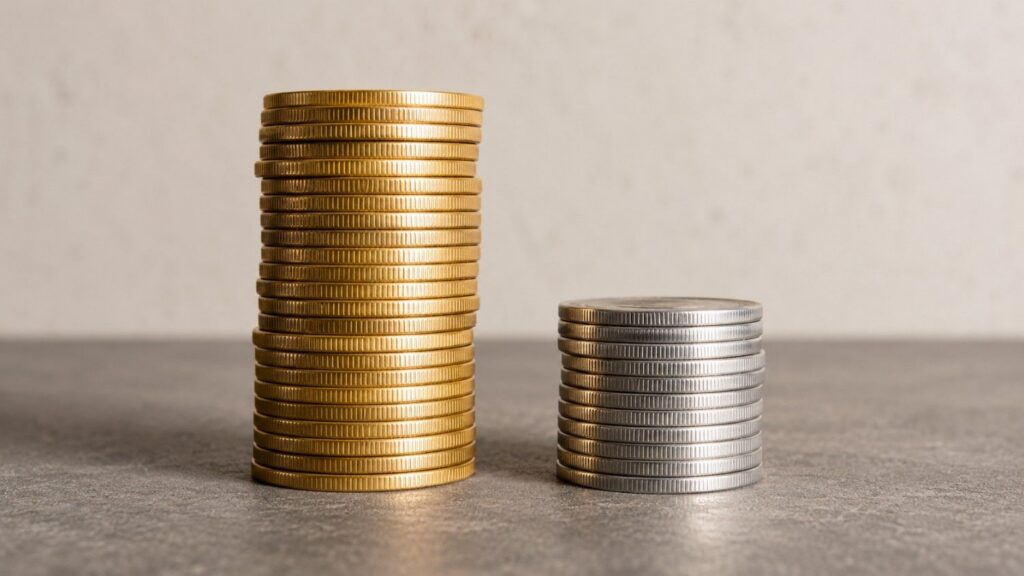
Gold is down 1.7% today. Silver is down 5.4%. The gold-silver ratio just hit 67 — and it’s not a valuation signal. It’s a real-time diagnostic of two forces colliding: the Iran peace dividend versus the Fed’s rate-hike threat. Here’s which one is winning, and why Thursday’s PCE report is the swing factor.
Half the Fed Wants a Hike. 45% of Central Banks Are Buying More Gold.

The Fed’s June 2026 dot plot split the committee down the middle on rate hikes, the dollar surged to its highest since May 2025, and silver posted its sharpest drop in weeks before recovering nearly 70% of the loss. The same week, the World Gold Council reported a record 45% of central banks plan to add gold. The headwinds are real. So is the floor.


