Silver Rises Over 120% YTD


The Economy Lost 23,000 Jobs. Gold Climbed Toward $4,400. Here’s the Mechanism.

When the US economy loses 23,000 jobs and gold climbs toward $4,400, most investors are confused. Here is the exact monetary mechanism that explains why a bad jobs report is consistently good for gold — and why the composition of this rally makes it more durable than most.
Two Inflation Numbers Come Out Every Month. The Fed Only Cares About One.
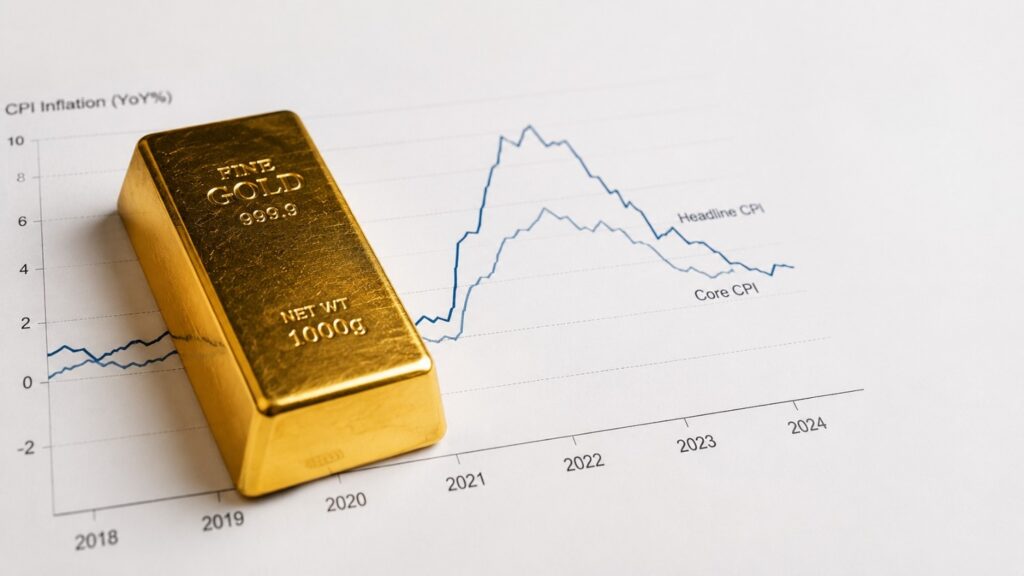
The Fed releases two inflation numbers every month — headline CPI and core CPI. They tell very different stories, and the Fed only acts on one of them. Here is what each measure captures, why the Fed leans on core PCE to set interest rates, and why that gap between what you pay and what the Fed watches matters for gold investors.
M2 Money Supply: The Number That Makes Your Portfolio Meaningless
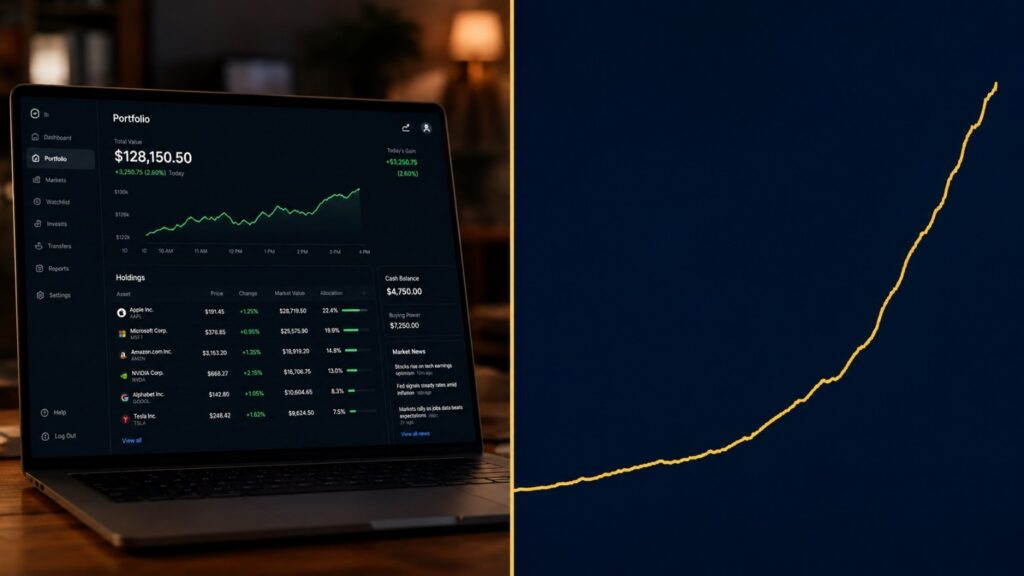
Most investors check their portfolio every day. Very few have ever looked at a chart of M2 money supply. That gap — between what feels important and what actually is — turns out to be one of the most expensive mistakes a long-term saver can make. Here is what M2 is, why it grew 55 percent since 2020, and why it tells you something your portfolio never will.
Why Is Gold So Expensive? The 5 Mechanisms Behind the Price
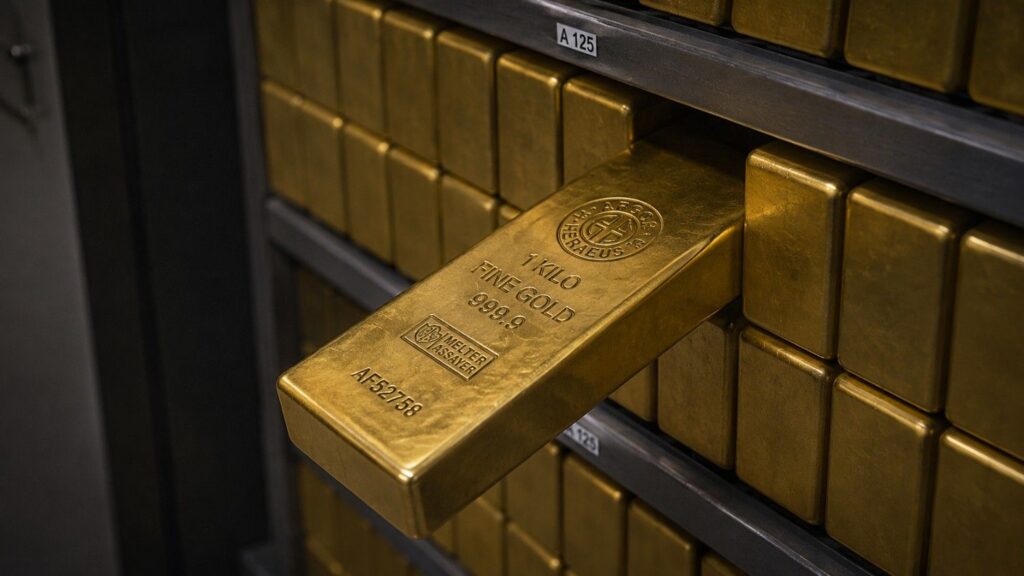
Gold costs roughly $4,000 per ounce today. Here are the five specific, measurable forces that explain exactly why — and why every major bank expects the price to go higher.
Gold Didn’t Fall on Iran Peace News. That’s the Point.
Trump called off a planned strike on Iran Monday afternoon. Oil fell over 1%. Gold slipped 0.23%. That’s not a non-event — it’s a signal. The gold price isn’t moving on war or peace news because it’s no longer the war holding it up. It’s the Fed trap: a central bank that can’t raise rates into a $39 trillion debt and can’t cut while inflation runs hot. Until that changes, the floor holds.
What Moves Gold Prices? 6 Key Gold Price Factors Explained
Gold hit an all-time high of $5,589 in January 2026 — then pulled back 18%. Here are the six macroeconomic factors that move gold prices, and why understanding them matters more than tracking the daily chart.
Why Peace Is Bullish for Gold in 2026 (And War Isn’t)
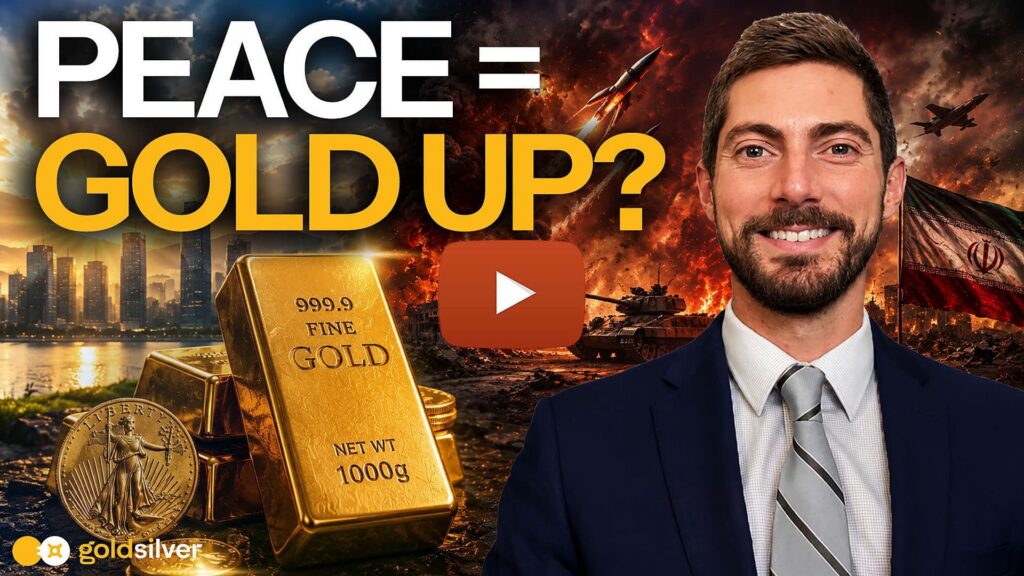
War usually pushes gold higher. But since Operation Epic Fury began in February 2026, the opposite has played out — gold sells off on escalation and rallies on peace. The reason ties back to fiscal dominance, oil prices, and the path to lower interest rates. This article breaks down the pattern, the macro logic behind it, and what it means for short-term and long-term gold investors.
Gold Price and the Jobs Report: A Pre-Market Guide

Economists expect just 49,000 jobs on May 8 — down from 178,000 prior. Before the number drops, here are the three scenarios every gold investor needs to understand, and what each one means for gold price.
The Real Reason Gold Is Down During an Oil War

Gold is down 10% since the Iran War began — while oil is up nearly 60%. If gold is an inflation hedge, why is it falling during an inflation shock? The answer comes down to one distinction most investors miss: paper gold and physical gold are not the same thing, and they don’t respond to the same forces.
The 1970s Gold & Silver Bull Run: Causes, Returns, and Lessons for Investors
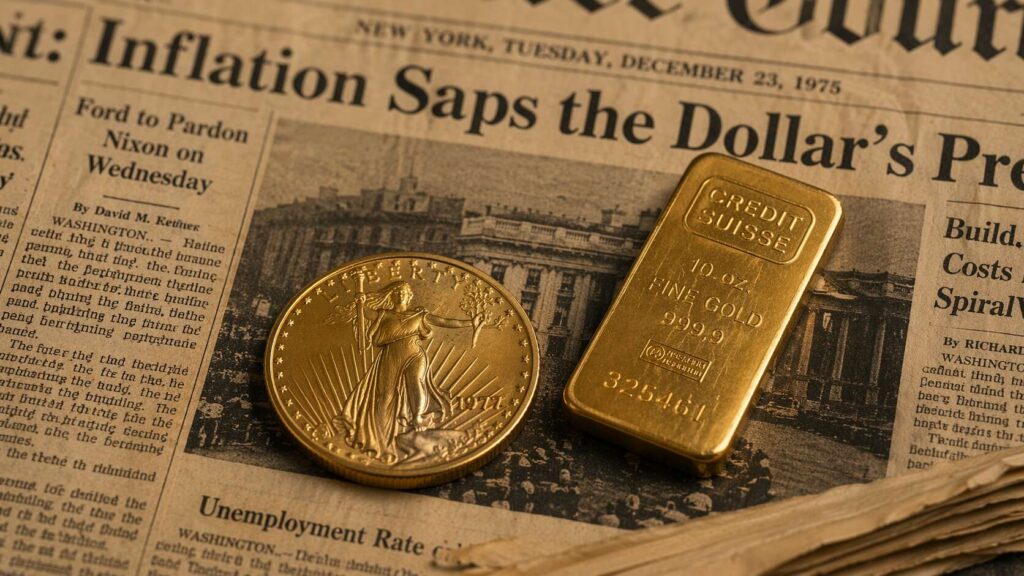
The 1970s gold and silver bull run remains one of the most dramatic wealth events of the 20th century. Gold rose 2,300%. Silver gained 400% in a single year. Understanding what drove that decade-long move — and what finally ended it — gives modern investors a precise framework for reading today’s precious metals market.