 Silver Rises Over 120% YTD




Half the Fed Wants a Hike. 45% of Central Banks Are Buying More Gold.

The Fed’s June 2026 dot plot split the committee down the middle on rate hikes, the dollar surged to its highest since May 2025, and silver posted its sharpest drop in weeks before recovering nearly 70% of the loss. The same week, the World Gold Council reported a record 45% of central banks plan to add gold. The headwinds are real. So is the floor.
The Fed Went Silent. Gold Holders Don’t Need It to Speak.
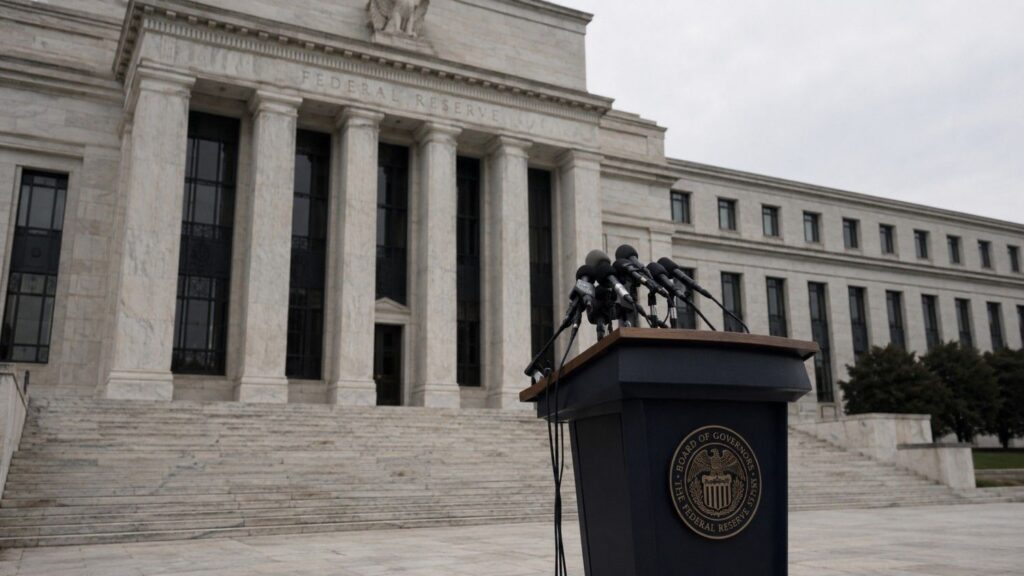
Kevin Warsh scrapped forward guidance and skipped the dot plot at his first Fed meeting. Paper gold fell 2%, then recovered. Here’s why the biggest shift in Fed communication since 2008 leaves the structural case for physical gold exactly where it was.
The Fed Just Killed Its Rate Roadmap. Here’s What That Means for Gold.
The Fed held rates steady. That wasn’t the story. Kevin Warsh withheld his dot plot entry — the first Fed chair in 14 years to do so — and quietly ended the forward guidance era that has guided markets since 2012. Here’s what that shift means for gold.
Gold Holds at $4,347 While Stocks Hit All-Time Highs. Here’s Why.
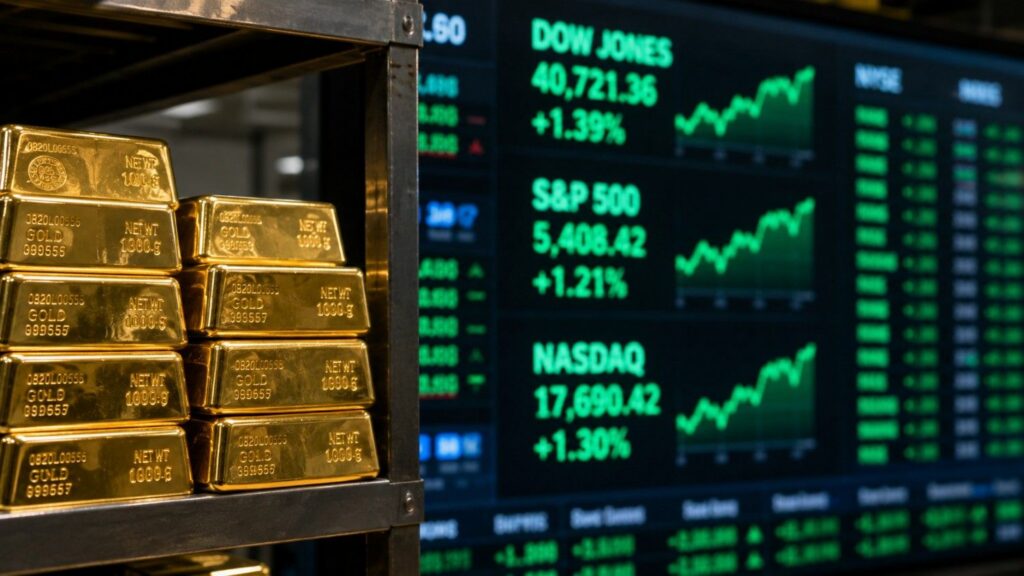
The Iran peace deal removed the war premium from gold. But the monetary premium — driven by $39 trillion in US debt, central bank buying, and fiscal deficits — is untouched. Here’s why gold held while stocks hit records, and what Warsh’s FOMC press conference means next.
Iran Peace Deal Sends Oil Down 5%, Gold Up 3%
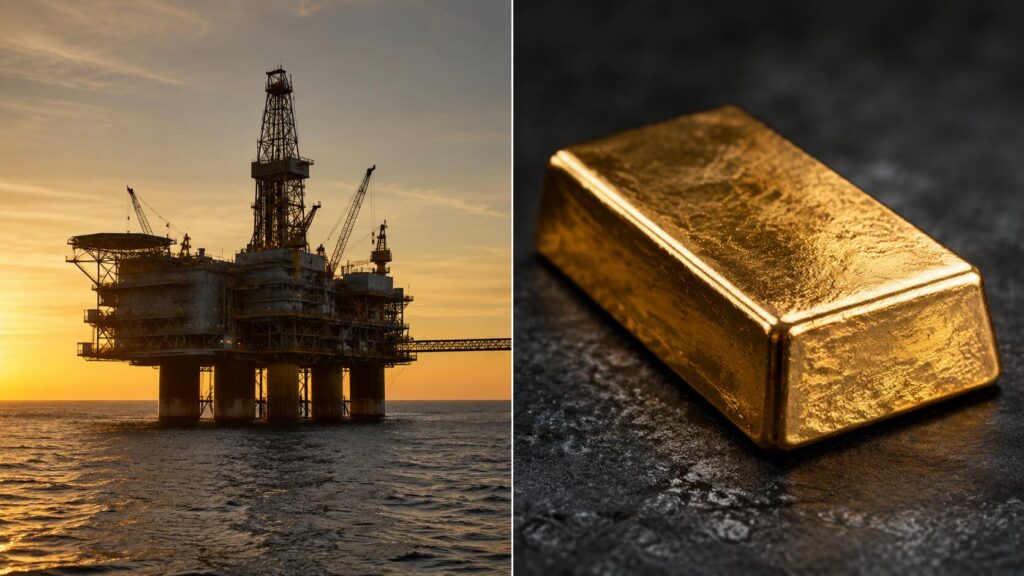
The Iran peace deal was supposed to hurt gold. It didn’t. Here’s why oil falling 5% is pushing gold higher — and what that tells long-term holders about the monetary chain driving precious metals right now.
Gold & Silver Surge on Iran Peace Deal — Then Pull Back

Gold and silver surged Friday on Iran peace deal hopes, then pulled back. The real story is the oil drop — and the inflation chain it may be unwinding. Here’s the mechanism behind today’s move and what it means heading into the Fed’s first meeting under Kevin Warsh on June 16–17.
Silver Fell 22% in 30 Days. Gold-Silver Ratio Hits 63.
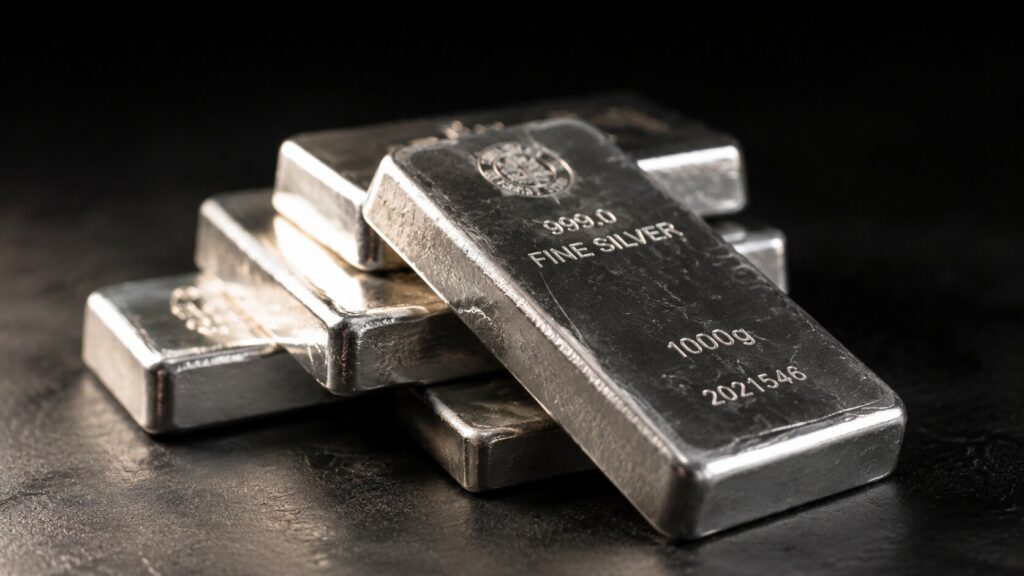
Over the past 30 days, silver has fallen more than twice as fast as gold. The gold-silver ratio now sits at 63 — up more than 8 points in a month. That move has a name, a mechanism, and a track record. Here is what drove it, and what comes next.
Every Bearish Catalyst Landed at Once. Gold and Silver Went Up Anyway.

Every bearish macro catalyst landed today at once — hot PPI, an ECB rate hike for the first time since September 2023, and a second night of US-Iran strikes. Silver opened at its lowest level since December 2025. By afternoon it was up 3.6%. Here’s what that market signal means for physical holders and what to watch before the FOMC on June 17.
Gold at Seven-Month Lows: Why Geopolitical Fear Is Not Enough

The Iran war should be pushing gold higher. Instead it is pushing the Federal Reserve toward rate hikes, suppressing the very safe haven the conflict should be lifting. Here is the mechanism behind five stories moving gold and silver today.
May CPI Printed 4.2%. Core Inflation Beat. So Why Did the Gold Price Drop?

May CPI came in at 4.2% — the fastest pace since early 2023 — and the gold price fell nearly $100 to 11-week lows. But the headline is almost entirely an energy story: gasoline is up 40.5% year-over-year while core CPI rose just 0.2% for the month, below forecast and down sharply from April. The market sold gold on a number it was already expecting. The data behind that number tells a different story.


