 Silver Rises Over 120% YTD




How Gold Price Is Set: The East-West Tide Explained

For 90 years, gold has moved in a recurring tide between Western financial markets and Eastern physical holders. Understanding who sets the price — and why that mechanism is shifting — is the most useful mental model a gold investor can carry.
Gold Is Down 9%. The CPI Print That Could Either Extend the Drop — or End It.
Gold is down 9% from its April high near $4,800. Two forces drove the pullback: the Iran–Israel ceasefire unwound the geopolitical risk premium, and a blowout jobs report pushed Fed rate-hike odds to 68–70% by December. The May CPI print is the next catalyst. Here’s the mechanism behind the move — and what each scenario means for physical holders.
Gold Price News: Goldman, China, CPI, and the Fed Explained
Goldman Sachs just pushed every 2026 rate cut to 2027. China’s central bank bought gold for the 19th month in a row. CPI drops Wednesday. A fragile ceasefire is holding — barely. And silver just had its worst week relative to gold in months. Here is what each story means for precious metals investors.
Gold Near $4,330 as Rate-Hike Bets Hit 70% and China Acts
Five forces are moving gold and silver right now. Strong U.S. jobs data has pushed Fed rate-hike odds above 70%. China’s biggest banks raised gold trading margins to 120% — pushing leverage below 1x. The People’s Bank of China extended its buying streak to 19 straight months. Iran announced an end to its military operation against Israel, steadying metals after last week’s 5% pullback. And elevated oil is keeping inflation expectations alive. Here is what each one means for long-term precious metals holders.
Gold Is Down 22% — The Same Drop as 2022. The Floor Is Not the Same.
Gold has fallen 22% from its January 2026 all-time high of $5,589 — the same magnitude as the entire 2022 Fed hiking cycle. But in 2022, the Fed delivered 525 actual basis points of rate increases. Today, markets are pricing roughly a 43–50% probability of a single speculative hike that hasn’t happened yet. Same number. Very different floor. Here’s what the gap between those two corrections is telling long-term holders of physical gold.
Gold Rate Hike Fears Are Weighing on Prices. Here’s the Full Picture.

Gold slipped to $4,448 this week as rate-hike fears and Middle East tensions drove a 2% weekly loss. Central banks bought 244 tonnes in Q1 2026 — yet retail demand has cooled sharply. With May jobs data due today and gold holding just above its 200-day moving average, here is what five key developments mean for anyone holding precious metals right now.
Gold at $4,480: Physical Demand Hits a 50-Year Milestone
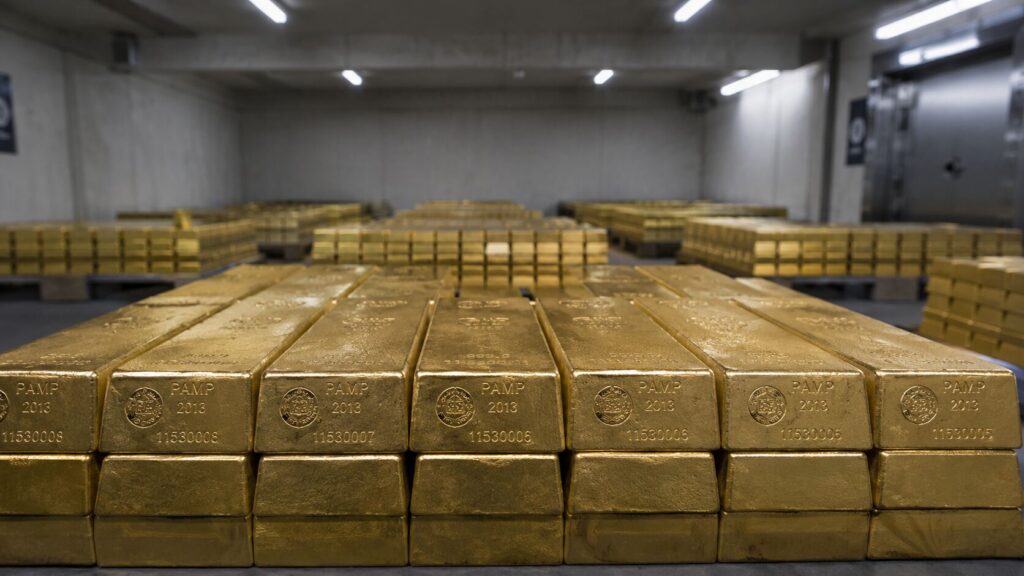
Central banks reshape gold markets through the most concentrated sovereign buying in decades — but that’s only one of five forces moving gold right now. Physical investment is overtaking jewelry demand for the first time on record. Russia’s figures don’t add up. China just hit the brakes. Here’s what’s driving the market.
Gold Holds $4,481 With Rate Hike Risk Rising. Here’s the NFP Decision Map.
Gold is holding near $4,481 with rate hike risk rising — a divergence that, in any prior rate cycle, would have already sent gold lower. Tomorrow’s May jobs report is the last major data point before Warsh’s first FOMC meeting June 16–17. Here’s the three-scenario decision map: what a hot print, an in-line print, and a soft miss each mean for gold — and why the Fed’s policy trap makes the structural case for sound money regardless of Friday’s number.
Rate Hike Odds Just Hit 85%. Gold Is Up. Here’s Why.
Rate hike odds just hit 85%. Gold is up anyway. Most headlines won’t explain why — because the answer requires flipping the standard model upside down. The number that actually drives gold isn’t the fed funds rate. It’s the real yield. Here’s the mechanism.
Gold Surges 1.5%: ADP, ISM, and Beige Book Trap the Fed

Five data points landed Wednesday that should have pressured gold. Instead, gold surged 1.5%. Each event tightens the same Fed trap — and gold trades on the trap, not the direction the Fed falls.


