 Silver Rises Over 120% YTD




Gold Is Closing Its Worst Quarter Since 2013. A War Made It Happen.
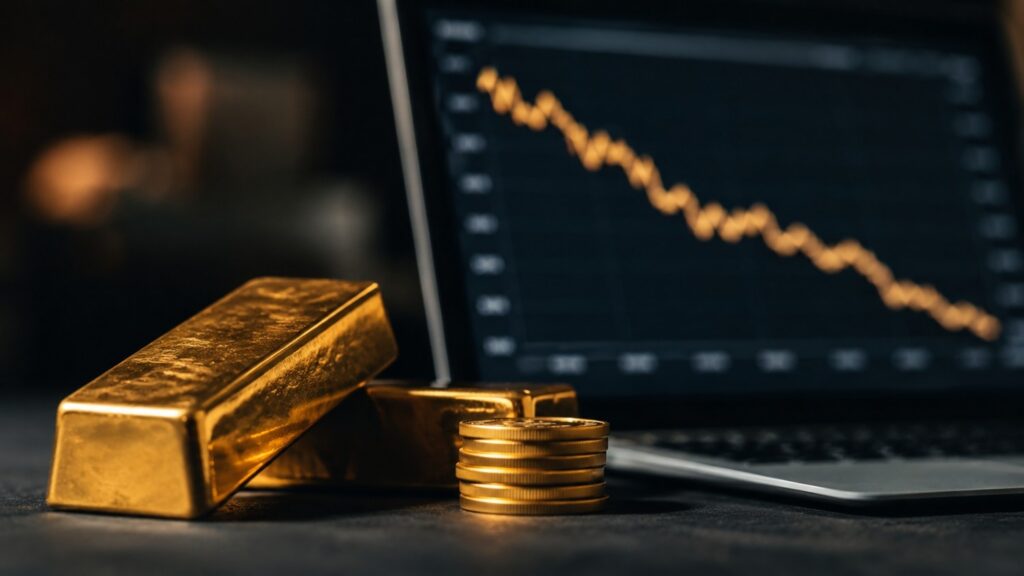
Gold entered Q2 at around $4,700. It is leaving at $4,015. That is the worst quarterly decline since the 2013 taper tantrum — and the cause is a war, not despite one.
Why Is Silver Down 5%? The Gold-Silver Ratio Explains.
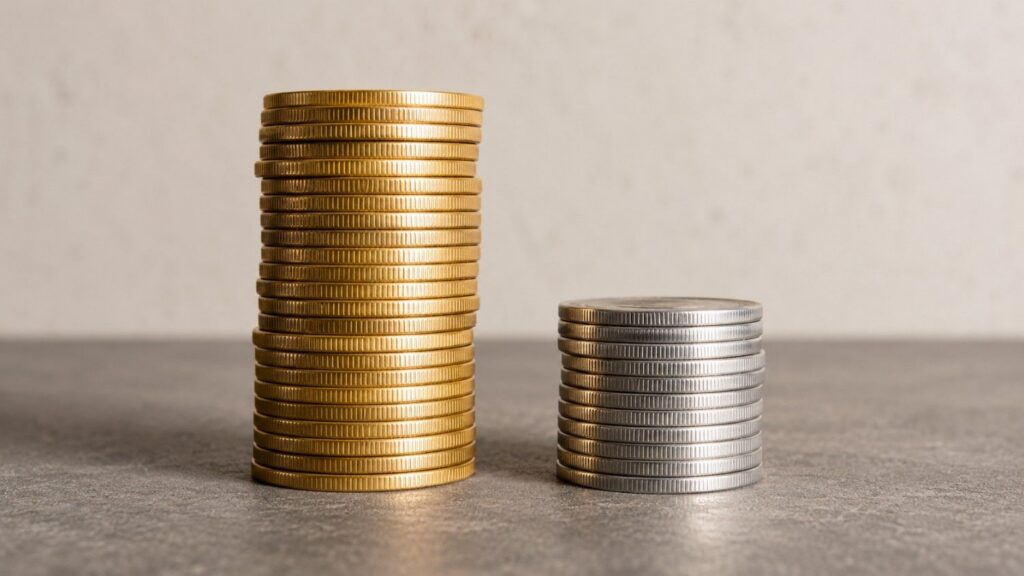
Gold is down 1.7% today. Silver is down 5.4%. The gold-silver ratio just hit 67 — and it’s not a valuation signal. It’s a real-time diagnostic of two forces colliding: the Iran peace dividend versus the Fed’s rate-hike threat. Here’s which one is winning, and why Thursday’s PCE report is the swing factor.
Gold Is Down 25%. Morgan Stanley Says One Number Unlocks $5,200.
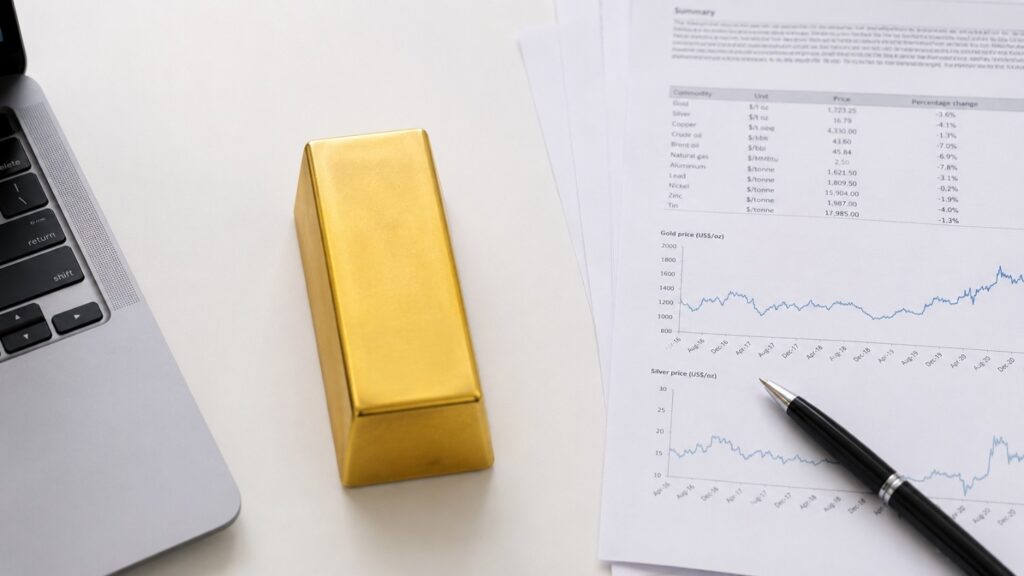
Gold hit $5,589 in January. Today it’s at $4,177. Morgan Stanley says the structural case for $5,200 is intact — but one specific buyer type hasn’t shown up yet. Here’s the chain that explains why, and what turns it back on.
Gold Silver Ratio at 64: What It Signals for Silver in 2026
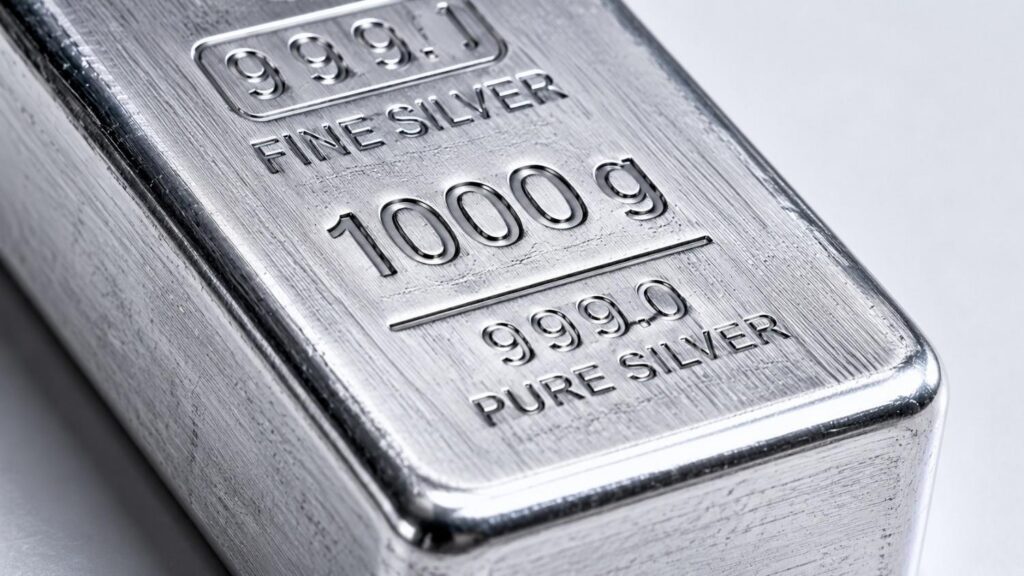
The gold/silver ratio fell from 85:1 to 64:1 in five weeks. History shows that at this level, compression is typically just beginning — not ending. Here’s what three major bull cycles say about where silver stands today.
Why Is Gold Still a Safe Haven? Switzerland’s Biggest Refiner Just Answered.

Valcambi’s incoming CEO processed 1,000 tonnes of gold last year for national banks and bullion traders. Here’s the institutional case for why gold remains a strategic safe haven in 2026 — and what central bank behavior reveals about where the global monetary system is heading.
Gold Confiscation: Could the Government Take Your Gold Again?
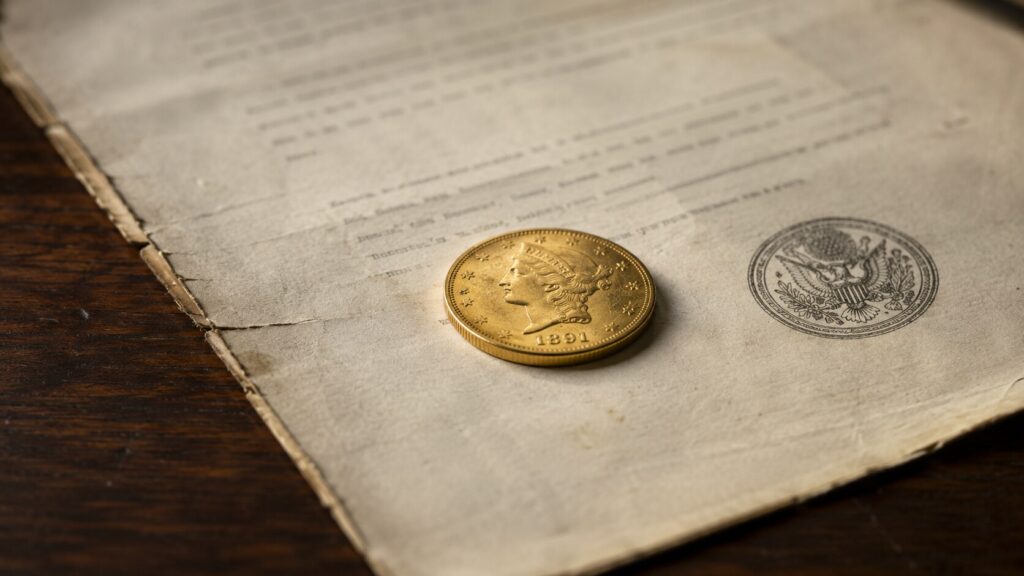
In 1933, the US government ordered Americans to surrender their gold at $20.67 an ounce — then revalued it to $35 and kept the difference. It was legal. It worked. But five major crises have passed since private ownership was restored in 1975, and confiscation has not happened once. Here is what actually changed, why the legal bar is now substantially higher, and what modern allocated ownership means for the question every gold investor eventually asks.
Gold Price History: From $35 to $4,500 in 100 Years
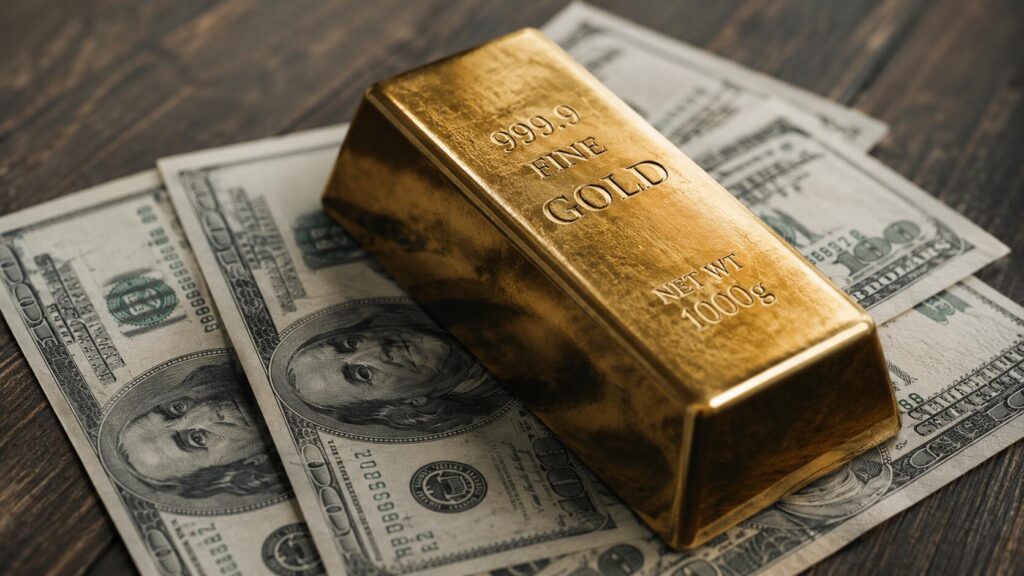
Gold went from $35 in 1971 to around $4,500 today — a 12,000% gain since the gold standard ended. Meanwhile, the dollar lost 96.9% of its purchasing power over the same period. These are not two separate stories. This is the complete gold price history: decade by decade, the real cause behind every major move, and what a century of data tells investors right now.
Silver Has Two Engines. Stagflation Is the One Condition That Fires Both at Once.

Most assets have a simple relationship with stagflation. Silver doesn’t. It answers to two entirely separate demand pools — industrial and monetary — that in most macro environments pull against each other. Stagflation is the rare condition where both pull in the same direction at once. Here’s why that matters for investors holding physical silver today.
Gold or Silver First? A First-Time Buyer’s Framework
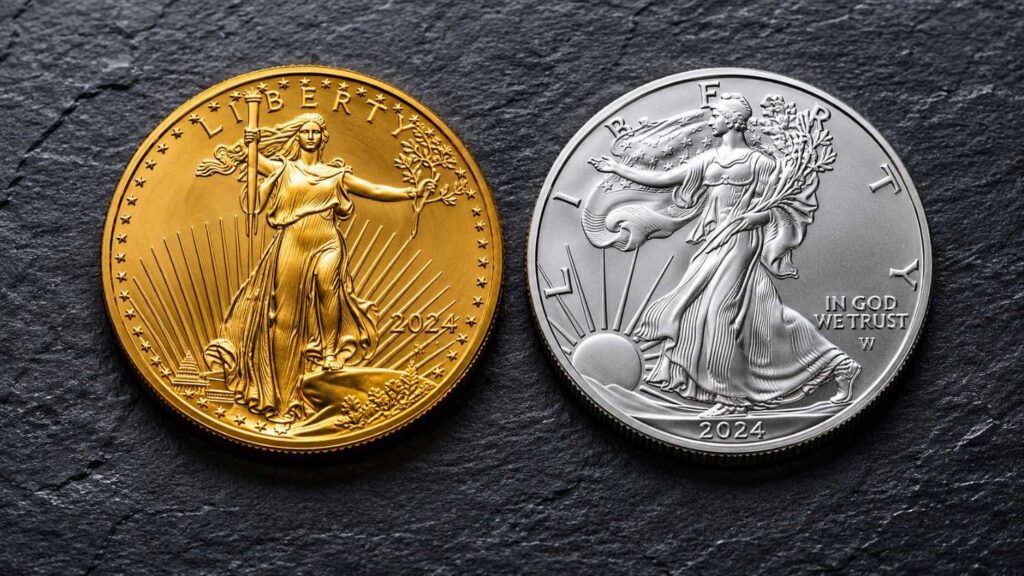
Most guides tell you gold is safer and silver is cheaper. That’s true and useless. This 4-question framework maps your budget, goals, storage, and liquidity needs to a clear starting point — so your first precious metals purchase is the right one.
Gold Is Down Today. Here’s Why Smart Money Is Still Buying.
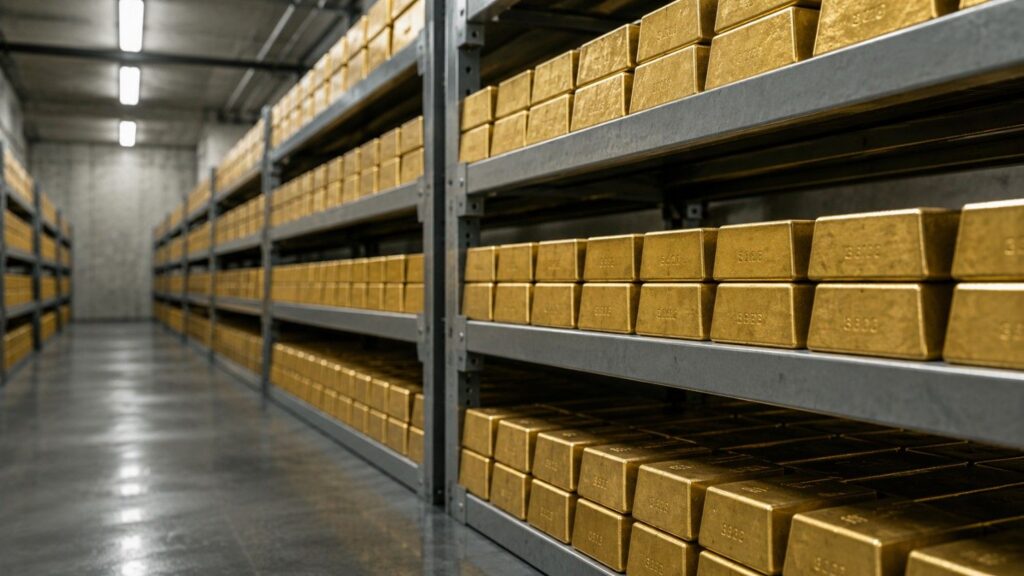
Gold is falling today. The Iran conflict, oil prices, and a hawkish Fed are creating short-term pressure. Central banks, Goldman Sachs, and Asian ETF buyers are pointing the other direction. Here’s how to read the gap.


