Published: 03-24-2026, 10:31 am | Updated: 03-25-2026, 11:00 am
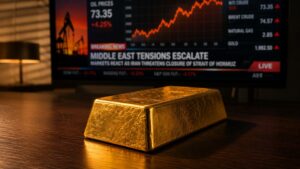
Gold is down more than 17% over the past three weeks. Last week alone, it fell more than 10% — the worst single week for gold since March 1980. That’s nearly half a century.
It’s jarring. And if you’re holding physical gold right now, you probably want answers.
Here’s what the data actually shows — and why the panic may be misplaced.
Is This the Worst Drop Gold Has Ever Had?
Not quite. But it’s close.
GoldSilver analyst Alan Hibbard pulled data going back decades to put last week’s move in context. Gold fell 10.66% in the week ending March 20th. The only comparable drop in modern history was March 1980, when gold shed 12.12% in a single week.
Reports have pegged this as gold’s worst week in 42, 43, or 44 years depending on the data set. The exact number doesn’t matter. The point is the same: this kind of move is extraordinarily rare.
But rare doesn’t mean unprecedented — and understanding what happened during past crashes tells you a lot about what comes next.

Get Expert Insights from Alan Hibbard Learn from Alan Hibbard, a trusted voice in precious metals delivering clear, actionable analysis on gold, silver and the global economy.
What Do the 10 Worst Weeks in Gold History Actually Show?
Alan mapped out the top 10 worst weekly drops for gold across the entire modern price history. The pattern is striking.
Four of those 10 worst weeks happened during the bull market of the 1970s. Gold went on to make new highs after every one of them. The trend didn’t break. It continued.
Three more happened in a tight cluster at the start of 1980. That period was genuinely exceptional — the COMEX restricted silver trading to liquidation orders only, triggering cascading sell-offs across both metals. Gold swung 26% down one week, 16% up the next, then 12% down the week after. Three extreme moves in three consecutive weeks. It’s nearly impossible to compare that moment to any other period in gold’s history, including today.
The remaining three data points? The 2008 financial crisis, COVID, and now — Iran.
In both 2008 and COVID, gold sold off hard and fast. Then it recovered. Then the bull market resumed. The drop looked catastrophic in the moment and was largely irrelevant within a year.
The takeaway: a bad week doesn’t break a trend. If anything, it usually confirms it.
Why Is Gold Falling When It Should Be Rising?
This is the question that confuses most people — and it’s worth understanding clearly.
Oil prices are fracturing. Energy costs are surging. A war is expanding. By every traditional measure, this should be bullish for gold: geopolitical risk, inflation pressure, higher mining costs. So why is gold selling off?
The answer is forced deleveraging.
When oil prices spike sharply, they create margin stress across commodity desks. Funds that are underwater on energy positions need to raise cash — fast. They sell whatever they can sell, not what they want to sell. Gold is highly liquid. So gold gets sold.
This isn’t a signal that the gold thesis is broken. It’s a signal that the financial system is under acute stress. In those moments, correlations collapse. Everything sells off together — gold, equities, crypto. The war plus the energy shock is fundamentally bullish for gold. But liquidity crises operate on a different timetable.
We saw the exact same dynamic in March 2020. Gold fell sharply as COVID panic triggered forced selling across the board. Weeks later, it was recovering. Months later, it hit all-time highs.
The real question isn’t why gold fell. It’s what happens after the forced selling ends.
What Should You Actually Do Right Now?
That depends entirely on your time horizon — and this is where most investors go wrong.
If you’re thinking in terms of days, the war in Iran has been a clear sell signal for gold. There are better short-term plays right now: oil, energy infrastructure, options strategies tied to geopolitical volatility. Day traders and institutions already know this.
If you’re thinking in terms of years, this looks like a buy signal. Gold is temporarily on sale. The macro drivers — dollar debasement, central bank demand, de-dollarization — haven’t changed. They’ve arguably strengthened. If you were planning to accumulate gold over the next five to ten years, a 17% pullback is an opportunity, not a threat.
The dangerous zone is the middle: months. Trying to call the exact bottom, predict the recovery timeline, or trade around a geopolitical event on a 3-to-6-month horizon is genuinely hard. Alan’s take: if that’s your window, treat this as noise. Hold your position and watch something else.
The long-term thesis isn’t broken. It’s on sale.
Watch the Full Video
Alan walks through all 10 worst weeks in gold history, breaks down the oil market divergence driving forced selling, and explains exactly how to think about your position right now — depending on whether you’re a day trader, a long-term holder, or somewhere in between.
Watch: Gold’s Worst Week in 46 Years: Should You Be Worried?
Stay On Top of Gold & Silver Prices
Get important market alerts sent straight to your inbox.
People Also Ask
Why did gold drop so much in March 2026?
Gold fell more than 17% over three weeks due to forced deleveraging triggered by surging oil prices from the Iran war — not a breakdown in gold’s fundamentals. When energy prices spike, funds sell liquid assets like gold to cover margin calls, regardless of gold’s underlying value. GoldSilver analyst Alan Hibbard breaks down exactly why this happened and what history says comes next.
Is the gold bull market over?
Based on the 10 worst weekly drops in gold’s history, a single bad week has never ended a bull market — the long-term trend continued in every comparable case. Four of those worst weeks happened during the 1970s bull run, and gold went on to make new highs after each one. The current pullback looks more like a flush before repricing than a structural reversal.
What happens to gold prices during a war?
In the short term, wars can actually push gold lower if they trigger an energy shock and liquidity crisis — because forced selling overrides gold’s safe-haven role temporarily. Over the medium and long term, war, inflation, and geopolitical instability are historically bullish for gold prices. The key is distinguishing between short-term liquidity dynamics and the multi-year macro trend.
Should I buy gold during a market crash?
If you’re a long-term investor with a 5-to-10-year horizon, sharp pullbacks in gold have historically represented buying opportunities — not exit signals. GoldSilver’s analysis of every major gold sell-off shows that investors who held through acute stress periods were rewarded as the trend resumed. The exception is if you’re trying to trade gold on a 1-to-3-month timeframe, which is far harder to do successfully.
Why does gold fall when oil prices rise?
Rising oil prices create margin stress across commodity trading desks, forcing funds to sell whatever assets they can liquidate quickly — and gold, being highly liquid, often gets sold first. This forced deleveraging causes gold to temporarily drop even when the fundamental case for owning it is strengthening. Once the acute selling pressure ends, gold typically recovers and resumes its prior trend.
You May Also Like:
- Are Silver Investors Watching the Wrong Numbers?
- Is $400 Silver Possible? What the 1979 Pattern Suggests
- The $20,000 Gold Options Trade: Insider Signal or Smart Hedge?
- Gold Just Closed Above $5,000. What Happens Next?
- Retail Investors Just Set a Record. History Says Be Careful
- COMEX Default in March? The Truth Behind the Silver Shortage Claims