Published: 04-06-2026, 12:45 pm | Updated: 04-06-2026, 12:50 pm
Most economic downturns punish one asset class at a time. Stagflation punishes nearly all of them at once.
Stocks struggle when growth stalls. Bonds erode when inflation runs hot. Cash loses purchasing power quietly, year after year. The usual hedges either don’t work or make things worse.
Gold and silver are different. Their track record across stagflationary periods spans more than 50 years — and the data is unusually clear.
This article breaks down what stagflation actually is, what happened to precious metals during the 1970s, and why the current macro environment deserves close attention.
What Is Stagflation — and Why Is It So Hard to Fix?
Stagflation is the simultaneous occurrence of high inflation, slow or negative growth, and rising unemployment [Federal Reserve History].
Under normal conditions, inflation and unemployment move in opposite directions. This is the Phillips Curve. When the economy runs hot, prices rise. When it cools, inflation eases.
Stagflation breaks that relationship. Prices keep climbing even as growth slows and joblessness rises. That puts policymakers in an impossible position. Raise rates to fight inflation, and you risk deepening the economic slowdown. Cut rates to stimulate growth, and you risk making inflation worse.
There is no clean solution. That’s what makes stagflation so damaging — and so rare.
The 1970s remain the defining modern example. Two oil shocks, persistent price pressure, and a Federal Reserve that consistently fell behind the curve produced one of the most painful decades in American economic history [Federal Reserve History, “The Great Inflation”]. By the summer of 1980, U.S. inflation was running near 14.5%. Unemployment had climbed above 7.5% [Federal Reserve History, “The Great Inflation”]. Both were still rising.
What Causes Stagflation?
Stagflation needs two ingredients: a supply shock and a policy mistake.
A supply shock raises production costs without creating new output. Oil embargoes, supply chain collapses, broad import tariffs — all push prices higher economy-wide, regardless of demand.
A policy mistake happens when authorities respond too slowly, or in the wrong direction. Loose monetary policy during a supply shock doesn’t stimulate growth. It just adds inflation to an already stressed system.
The 1970s had both — and the seeds were planted before the decade began. Unemployment and inflation were already rising together in the late 1960s. Then the OPEC oil embargo of October 1973 quadrupled energy prices overnight. A second shock followed in 1979. Energy prices rose 21.6% in 1974 alone, and 37.4% in 1979 [NBER, Blinder].
The Federal Reserve’s response made it worse. Rates stayed too low for too long. Inflation ran above 6% for the full decade — peaking above 11% in 1974 and above 13% by 1980 [Federal Reserve History, “The Great Inflation”]. That combination — external shock plus policy paralysis — is what turns inflation into stagflation.
What Happened in 1971? The guide that explains the moment our financial system changed.
How Did Gold Perform During the 1970s Stagflation?
The short answer: better than almost anything else. At the start of the decade, gold was locked at $35 per ounce — the fixed rate established under the Bretton Woods system [Federal Reserve History, “Nixon Ends Convertibility”]. On August 15, 1971, President Nixon suspended the dollar’s convertibility to gold. The fixed rate was gone. Gold was free to move.
It moved. By January 21, 1980, gold hit $850 per ounce at the LBMA Afternoon Fix in London [LBMA / BullionVault] — a nominal gain of more than 2,300% from the $35 floor over roughly nine years. Inflation-adjusted returns were smaller, but gold still dramatically outperformed stocks and bonds. More importantly, it held its purchasing power at a time when the dollar did not.
The rise wasn’t linear. Gold peaked near $193 in December 1974, then fell to roughly $113 by August 1976 — a correction of about 40% [JM Bullion, Gold Price History]. It then doubled again before the decade ended. Investors who held through the drawdown were rewarded. Investors who sold near the bottom locked in a loss inside a secular bull market.
That pattern matters. It’s a reminder that even historically strong trades require conviction — and time.
Why Does Gold Usually Rise During Stagflation?
It comes down to one concept: real interest rates.Real rates are nominal rates minus inflation. When inflation outpaces the yield on cash or bonds, real rates turn negative. At that point, holding dollars or Treasuries costs you money in purchasing power terms — quietly, every year.
That’s when gold becomes compelling. It pays no yield, but in a negative real rate environment, that’s beside the point. The opportunity cost of holding gold effectively disappears [World Gold Council, “You Asked, We Answered: Explaining Gold’s Recent Performance”].
The 1970s were a textbook case. The Fed allowed inflation to run well ahead of policy rates for years. Real rates were deeply negative for extended stretches. Investors rotating out of dollars and bonds weren’t being contrarian — they were responding rationally to a system that was paying them negative real returns.
Gold was one of the few places to go.
The World Gold Council’s more recent research confirms the pattern holds beyond the 1970s. Stagflation — specifically, rising inflation expectations combined with falling growth expectations — has historically triggered increased gold demand, particularly from ETF investors and retail bar-and-coin buyers [World Gold Council, Gold Market Commentary, August 2025]. The mechanism is the same. The asset class is different. The logic is not.
Did Silver Outperform Gold During Stagflation?
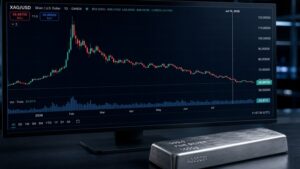
Silver’s 1970s performance was even more dramatic than gold’s — and considerably more complicated.
In 1970, silver traded at approximately $1.50 per ounce [Encyclopaedia Britannica, “Silver Thursday”]. By January 18, 1980, the London Fix recorded a peak of $49.45 per troy ounce, with COMEX intraday futures briefly touching $50.35 [Wikipedia, “Silver Thursday”]. That’s a nominal gain of more than 3,000% — surpassing even gold’s move in percentage terms.
The standard explanation credits — or blames — the Hunt Brothers. Two Texas billionaires who amassed enormous silver positions through the late 1970s and, the story goes, drove the price to unsustainable heights. It’s a compelling narrative. It’s also largely wrong.
Jeff Christian of CPM Group, one of the most widely cited analysts in precious metals, has estimated the Hunts contributed roughly $0.50 to $0.75 to the silver price — not $50 [GoldSilver.com, “The Hunt Brothers Silver Story Is Not What You Think”]. The real force was macro. Inflation was surging. Confidence in the dollar was collapsing. Investors worldwide were rotating into hard assets. Gold, silver, platinum, and palladium all hit record highs within months of each other in early 1980 [SDBullion, “1980 Hunt Brothers Silver Bailout & Scapegoating”]. No single market participant engineers that across four separate markets simultaneously.
Why did silver move so much? Because it plays two roles at once — monetary metal and industrial commodity. In an inflationary environment, both functions push the price in the same direction. That’s the amplifier effect.
It works in reverse too. When risk appetite falls, silver drops faster than gold. When a precious metals bull market accelerates, silver typically outpaces it. Gold stabilizes. Silver amplifies. They’re not interchangeable — they’re complementary, which is exactly how GoldSilver approaches the allocation question.
What Happens to Stocks and Bonds During Stagflation?
Stagflation is a bad environment for most conventional assets. The reasons are different for each — but the outcome is similar.
Equities get hit from two directions. Input costs rise, compressing margins. Growth slows, compressing valuations. The S&P 500 delivered close to zero real return across the 1970s as a whole [Robert Shiller, Long-Run Stock Market Data, Yale University]. Energy producers and commodity-linked companies were exceptions. But investors holding a broad index saw a decade of effort buy them essentially nothing in real terms.
Bonds face a more structural problem. Fixed coupon payments become worth less every year that inflation runs above the yield. And if the central bank eventually moves to crush inflation — as Volcker did, raising the federal funds rate from roughly 11% in 1979 to a peak near 20% in June 1981 — bond prices collapse in nominal terms too [State Street Global Advisors, “What Is Stagflation”]. Stagflation punishes you on the way up. Volcker punished bondholders again on the way out.
Cash is the quietest casualty. A 6% savings rate feels reasonable until inflation is running at 11%.
Gold and silver don’t pay a coupon or a dividend. In most environments, that’s a limitation. In stagflation, it’s close to irrelevant — because the assets competing with them are failing to deliver real returns anyway. The question stops being “what does gold yield?” and starts being “what is anything else actually worth?”
What Are the Risks of Holding Gold and Silver During Stagflation?
The historical record is strong. It’s not a straight line. Gold fell roughly 40% between its 1974 peak and its 1976 trough — from near $193 to approximately $113 — before resuming the bull market [JM Bullion, Gold Price History]. Investors who sold near the bottom locked in a real loss inside a decade that ended with gold up more than 2,000%. Conviction and time horizon matter as much as being right about the macro.
Silver carries more risk. Its industrial demand component means it can sell off hard even when gold holds up. The 1980 peak near $50 also involved unusual market dynamics — regulatory intervention restricted long positions mid-rally [Wikipedia, “Silver Thursday”]. The macro case for silver in the 1970s was genuine. The exact magnitude of the spike was not purely a macro event.
The bigger risk is a policy reversal. The stagflation trade runs on negative real rates. When Volcker drove real rates sharply positive — federal funds rate near 20% by June 1981 — the precious metals bull market ended. Gold peaked at $850 in January 1980 and spent the next two decades well below it. If real rates turn decisively positive again, the environment changes.
What Does the Current Gold Market Tell Us?
The numbers are hard to ignore. Gold crossed $3,000 per ounce for the first time on March 14, 2025. By late January 2026, it crossed $5,000. As of early April 2026, it’s trading near $4,672 [Fortune, April 6, 2026] — up more than $1,600 from a year prior. That puts gold well above its inflation-adjusted 1980 peak, which the LBMA had identified as the prior real-terms high watermark for more than four decades [LBMA Alchemist, Issue 118].
The drivers aren’t mysterious. The World Gold Council’s December 2025 outlook pointed to geopolitical uncertainty, a weaker dollar, and sustained central bank buying — central banks averaged roughly 27 tonnes of purchases per month throughout 2025 [World Gold Council, Gold Outlook 2026]. That’s institutional demand at a scale that doesn’t reverse quickly.
Whether this formally qualifies as stagflation is still debated. But the conditions that have historically supported gold — sticky inflation, slowing growth, compressed real returns on financial assets — are clearly present. The World Gold Council’s August 2025 market commentary named stagflation concerns as a direct driver of ETF and retail demand [World Gold Council, Gold Market Commentary, August 2025]. The debate over the label matters less than the underlying dynamics. Those dynamics are familiar.
Stay On Top of Gold & Silver Prices
Get important market alerts sent straight to your inbox.
People Also Ask
What is stagflation, and how is it different from a recession?
Stagflation is the combination of high inflation, stagnant economic growth, and elevated unemployment occurring simultaneously. A standard recession involves declining output, but inflation typically falls as demand weakens. Stagflation breaks that pattern: prices keep rising even as the economy contracts or stagnates, creating a policy dilemma for central banks. [Federal Reserve History, “The Great Inflation”]
Did gold go up during the 1970s stagflation?
Yes. Gold rose from a fixed rate of $35 per ounce in 1971 to a peak of $850 per ounce at the LBMA Afternoon Fix on January 21, 1980 — a nominal gain of more than 2,300%. Over the same period, the S&P 500 delivered close to zero real return. [Federal Reserve History / LBMA / Robert Shiller, Yale]
Is silver a better hedge against stagflation than gold?
Silver has historically delivered larger nominal gains than gold during precious metals bull markets, but with significantly higher volatility. In the 1970s, silver rose from approximately $1.50 to a peak of $49.45 per ounce on the London Fix. However, the silver move involved additional market factors beyond pure stagflation dynamics. Gold is generally considered the more stable and reliable inflation hedge. Most investors hold both for their complementary properties. [Encyclopaedia Britannica / LBMA via Wikipedia]
What causes stagflation?
Stagflation typically results from a supply-side shock — an event that raises production costs without generating additional output — combined with monetary or fiscal policy that keeps money flowing into the economy. The 1973 and 1979 oil shocks were the primary supply-side triggers in the 1970s. The Federal Reserve’s failure to tighten policy adequately amplified the problem. [NBER, Blinder / Federal Reserve History]
What ended the 1970s stagflation?
Federal Reserve Chairman Paul Volcker ended it through an aggressive tightening campaign. He raised the federal funds rate from approximately 11% in 1979 to a peak of around 20% in June 1981. Inflation fell from near 14% in the late 1970s to below 4% by 1983 — but the approach triggered 10% unemployment and a deep recession in 1981–1982. [State Street Global Advisors]
Should I buy gold and silver if stagflation is coming?
That depends on your individual situation, time horizon, and portfolio composition. Historically, gold and silver have preserved purchasing power during stagflationary periods better than most conventional assets. They are not risk-free — both metals can experience sharp corrections even within longer-term bull markets. A financial advisor can help determine what allocation makes sense for your circumstances.
Federal Reserve History: “Nixon Ends Convertibility of U.S. Dollars to Gold” and “The Great Inflation.”
LBMA / BullionVault: Gold Afternoon Fix peak of $850 per troy ounce, January 21, 1980.
LBMA Alchemist Issue 118: “Echoes of the ’80s? Gold Prices and Inflation Then and Now.”
World Gold Council: Gold Market Commentary, August 2025; Gold Outlook 2026; “You Asked, We Answered: Explaining Gold’s Recent Performance.”
Wikipedia: “Silver Thursday.” Confirmed silver London Fix peak of $49.45 per troy ounce on January 18, 1980.
Encyclopaedia Britannica: “Silver Thursday.”
GoldSilver.com: “The Hunt Brothers Silver Story Is Not What You Think.”
SDBullion: “1980 Hunt Brothers Silver Bailout & Scapegoating.”
NBER / Alan S. Blinder: “The Anatomy of Double-Digit Inflation in the 1970s.”
JM Bullion: Gold Price History.
Robert Shiller long-run stock market data: Yale University, Online Data.
State Street Global Advisors: “What Is Stagflation, and What Makes It So Bad?”
Fortune: Current price of gold, April 6, 2026.
This article is for educational purposes only and does not constitute financial advice. Price data should be verified against primary sources at time of publication.
This article is for informational purposes only and does not constitute financial or investment advice. Always consult a qualified financial advisor before making investment decisions.