Published: 04-30-2026, 05:07 pm
Gold and silver market update — April 30, 2026
Key Takeaways
- The BEA stripped investment silver from the GDP trade data for the third consecutive quarter — physical silver is moving at a scale the government’s own statisticians can no longer ignore.
- COMEX registered silver has been below the 15% coverage ratio stress threshold for six straight months. Today’s First Notice Day resolved quietly. The inventory pool is what to watch next.
- The paper price ($73.68 today) and the physical market are telling different stories. The BEA footnote, COMEX inventory trends, and a 762 million ounce stockpile drawdown are three independent sources pointing at the same conclusion.
This morning, the Bureau of Economic Analysis (BEA) published the Q1 2026 GDP advance estimate. The headline — 2.0% annualized growth, below the 2.2% consensus — sent the dollar lower and pushed gold back above $4,600. Silver rose 3.32% to $73.68.
Most analysts stopped there. However, buried in the same release was something more telling. Once again, the BEA removes silver from GDP — specifically, stripping investment silver bar exports from the national accounts. The reason: investment silver was moving in quantities large enough to distort the official trade data. That is not a routine accounting adjustment. Rather, it is the government confirming — in the driest institutional language available — that silver is functioning as a monetary metal at scale, right now.
Why Does the BEA Remove Silver From GDP Data?
GDP measures economic production. It does not count investment asset purchases — stocks, bonds, real estate, gold bars, or silver bars — as output. The logic is simple: buying a gold coin doesn’t create wealth, it reallocates it.
Silver is where this gets complicated. When physical silver crosses a border in large volumes, it shows up in Census Bureau trade data as an export. The BEA must then judge whether this silver is leaving as industrial raw material or as an investment asset to be stripped out.
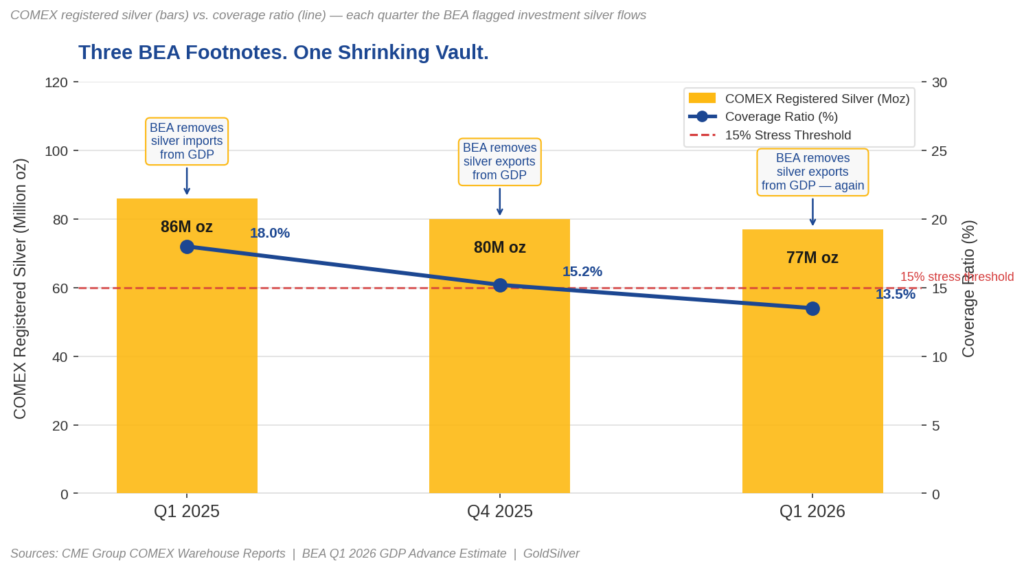
Three times now, across three consecutive GDP reports, the BEA has reached the same conclusion: strip it out. Specifically, the pattern looks like this:
- Q1 2025 (imports): Silver flowing into U.S. vaults at unusual volumes.
- Q4 2025 (exports): Silver bar exports flagged as investment flows.
- Q1 2026 (exports): The same call, made again this morning.
When the BEA removes investment silver from GDP — quarter after quarter — that is not noise. Instead, it signals a structural shift in how the world treats this metal.

The Edge Every Investor Needs Smarter precious metals investing starts here. The Nuggets Newsletter brings you essential market insights, Fed updates, global trends, educational videos, and much more.
What Is the COMEX Coverage Ratio — and Why Does It Matter Today?
Today’s GDP release landed at 8:30 a.m. ET — the same moment COMEX May silver contracts hit First Notice Day. First Notice Day is the earliest date a futures holder can be required to take physical delivery. At that point, holders must close, roll to July, or stand for delivery.
The COMEX coverage ratio is what makes this worth watching. Specifically, it measures what percentage of outstanding paper silver contracts could be filled by the registered, deliverable silver in COMEX-approved warehouses. Below 15% is stress territory — and notably, that is exactly where the market sits today.
As of April 27, 134.8 million ounces of May contracts were open. Against that, only 75–77 million ounces of registered silver sat in approved warehouses — a coverage ratio of 13–14% (CME Group). Moreover, that ratio has been below the stress threshold for six consecutive months without recovering.
Most May contracts rolled to July today, as expected. The delivery count is always unremarkable on First Notice Day. Nevertheless, that is not the signal. The signal is whether the registered inventory pool holds or shrinks in the days that follow. Ultimately, that is the number that will confirm whether today’s quiet resolution means anything at all.
Has Silver Crossed the Line From Industrial Metal to Monetary Metal?
The BEA has handled gold this way for decades. Nonmonetary gold — held as an investment rather than consumed industrially — gets stripped from GDP trade data. Because gold moves in volumes that blur the line between trade flows and capital flows, it gets treated differently from other commodities.
For most of financial history, silver didn’t qualify for that treatment. It was primarily an industrial metal. Consequently, GDP accountants handled it like copper or aluminum — just count the exports.
That changed. Indeed, the BEA’s recurring footnote is its institutional acknowledgment that silver has crossed the same threshold gold crossed long ago. It is now moving, in volume, as a monetary asset.
The distinction matters. Industrial metals are priced on fundamentals: mine output, manufacturing demand, inventory cycles. Monetary metals, however, are priced on trust — specifically, how much people trust paper alternatives to hold their value. In other words, gold and silver are not just commodities; they are confidence gauges.
When the BEA removes investment silver from multiple GDP releases, it is recording — in the most understated terms possible — that a meaningful number of people have stopped fully trusting those alternatives.
What Did the Financial Press Miss in Today’s GDP Report?
The 2.0% GDP headline dominated financial commentary. Analysts debated rate cut timing, recession risk, and pre-tariff distortions in tech equipment imports. Reasonable debates, all of them.
Nevertheless, what no one covered was the silver footnote.
The BEA’s language is deliberately bloodless. It doesn’t say investors are fleeing paper silver. Instead, it says: “BEA identified and removed an increase in exports of silver bars used as a form of investment in the first quarter.” (BEA, Q1 2026 GDP Advance Estimate, April 30, 2026.)
Read that in context — three consecutive GDP adjustments, a COMEX coverage ratio below 15% for six months, silver up more than 127% year-over-year — and the footnote reads very differently. In fact, it is the government’s own data corroborating what both the COMEX inventory trends and the World Silver Survey 2026 (Silver Institute / Metals Focus, April 15, 2026) are independently confirming: silver is behaving less like a commodity and more like money.
What Does This Mean for You?
No single data point should drive a portfolio decision. However, these three, taken together, describe a condition worth understanding:
- Large institutions, sovereign entities, and funds have taken physical delivery of silver at record pace for fifteen consecutive months (CME Group warehouse data).
- The above-ground silver stockpile has been drawn down by 762 million ounces over five straight deficit years (World Silver Survey 2026, Silver Institute / Metals Focus, April 15, 2026).
- The U.S. government’s own statisticians have flagged, three quarters running, that investment silver flows were large enough to require manual removal from the national accounts.
How Are Major Institutions Responding?
The paper price — $73.68 on April 30, 2026 (Trading Economics) — is what futures contracts cost. Importantly, what the BEA footnote tells you is that the physical market is doing something the paper price doesn’t fully reflect. This is precisely why the question of why the BEA removes silver from GDP data matters beyond statistical accounting.
Consider the institutional context. Central banks have been buying gold at record pace for three years running. Similarly, Sprott doubled its Physical Silver Trust capital raise program to $2 billion in January 2026 (Sprott Asset Management, January 20, 2026). Furthermore, these aren’t fringe moves. They represent the same analysis — paper versus physical, price versus condition — applied at institutional scale.
That’s not doomsday thinking. In short, that’s reading the footnotes.
Stay On Top of Gold & Silver Prices
Get important market alerts sent straight to your inbox.
SOURCES
1. Bureau of Economic Analysis — GDP Advance Estimate, 1st Quarter 2026
2. U.S. BEA — GDP Advance Estimate, 4th Quarter and Year 2025
3. U.S. BEA — Gross Domestic Product Data Archive (Q1 2025)
4. CME Group — COMEX Silver Warehouse Stocks and Delivery Notices
5. Silver Institute / Metals Focus — World Silver Survey 2026
6. Sprott Asset Management — Sprott Physical Silver Trust Updates At-the-Market Equity Program
7. Trading Economics — Silver Spot Price, April 30, 2026
Disclaimer: This article is for informational purposes only and does not constitute financial or investment advice. Always consult a qualified financial adviser before making investment decisions.
You May Also Like:
- PCE at 3.5%, GDP Miss: Why This Is Bullish for Gold
- How Warsh’s Inflation Measure Could Move the Gold Price
- Gold Is Down 19%. This $3.8B Bet Says It Doesn’t Matter
- Gold, Oil, and the Fed: Why the Old Rules Don’t Apply
- Why Turkey Sold Its Gold Reserves — And What It Proves About Sound Money
- Why Gold Spikes Every Time Hormuz Opens — And Why It Never Holds
- Oil Hits $100 and OPEC Is Fracturing. Gold Knows Why
- How China Restricts Silver Supply Without Touching Silver
- Powell Press Conference: What It Means for Gold