Published: 06-25-2026, 02:04 pm
Key Takeaways
- May PCE came in at 4.1% headline and 3.4% core — in line with consensus — allowing gold to recover above $4,000 after Wednesday’s seven-month low of $3,964.
- Gold’s recovery on a hot inflation print shows the “priced in” mechanic at work: when a rate-hike risk is already in prices, a data print that matches expectations removes the selling pressure.
- The gold market runs as two parallel markets: rate-sensitive paper traders (short time horizon) and central bank physical buyers (decade-long horizon). Central banks bought 244 tonnes net in Q1 2026 alone.
- Major institutional year-end targets — Goldman $4,900, JPMorgan $6,000, Wells Fargo $6,100–$6,300 — all sit well above current spot levels despite this week’s selloff.
- Physical gold holders saw no structural change this week. Margin calls, fund redemptions, and counterparty risk are paper-market problems. Physical ounces hold outside all three.
Gold spent three days getting pushed toward its lowest level since November 2025. Then the government confirmed inflation is still running at 4.1% — the fastest pace in more than three years. Gold went up anyway.
That is not a typo. It is a mechanic — and knowing it is the difference between holding through a selloff and selling into one.
By mid-morning on June 25, 2026, spot gold had recovered above $4,000 per ounce, up roughly 0.7% from Wednesday’s close. The Bureau of Economic Analysis confirmed its PCE price index rose 4.1% year-over-year in May — the highest reading since April 2023. [Bureau of Economic Analysis, Personal Income and Outlays, June 25, 2026] Core PCE, which strips out food and energy, rose to 3.4% from April’s 3.3%, in line with the Dow Jones consensus.
So why is gold rising on a print that still runs twice the Fed’s 2% target?
What Does “Priced In” Actually Mean for Gold?
When traders say a risk is “priced in,” they mean markets have already adjusted. In gold’s case, that shift happened last week.
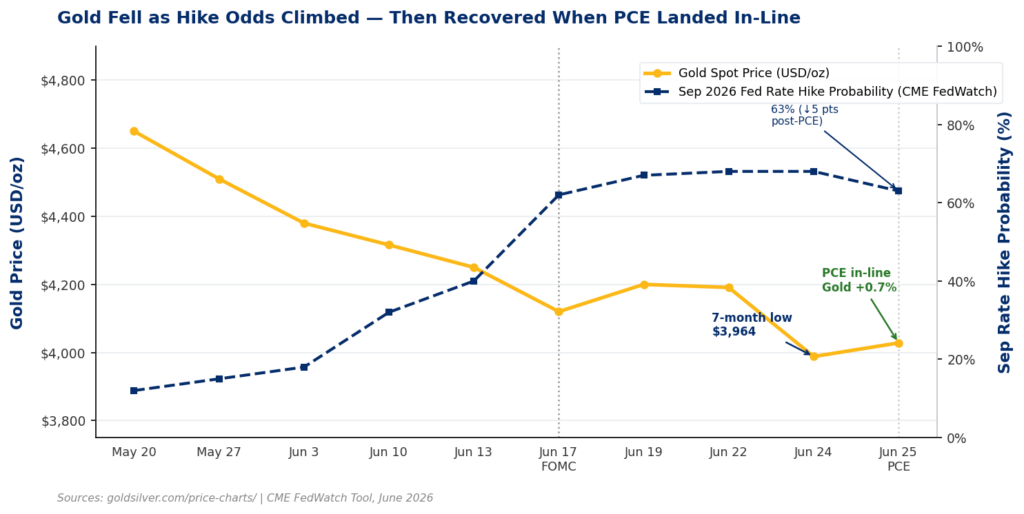
The Federal Reserve’s June 17 meeting was Chair Kevin Warsh’s first. Nine of the eighteen FOMC members who submitted projections backed at least one rate hike in 2026. [Federal Reserve, FOMC Statement and Summary of Economic Projections, June 17, 2026] The reaction was sharp: the U.S. Dollar Index surged above 101, its highest level since May 2025. Gold dropped from above $4,100 to $3,964 by Wednesday — a seven-month low.
By Thursday morning, traders had already repriced gold for a world where the Fed hikes in September. The CME FedWatch Tool put the odds of a September rate rise at 68% ahead of the data. Gold’s price at $3,980 already reflected that risk.
When PCE came in at consensus — hot, but not hotter than feared — the selling pressure lifted. No surprise meant no new reason to sell. The dollar eased. Treasury yields slipped. Gold found buyers.

The Edge Every Investor Needs Smarter precious metals investing starts here. The Nuggets Newsletter brings you essential market insights, Fed updates, global trends, educational videos, and much more.
Why Are Two Separate Gold Markets Moving in Opposite Directions?
Paper gold and physical gold now run on different logic — and that split held the floor this week.
The first buyer is rate-sensitive: futures traders, ETF managers, and macro hedge funds. They use gold as a rate-cycle trade. When rate hikes loom, they cut exposure. If cuts look likely, they add. Their view runs in weeks, not years.
The second buyer is the central bank reserve manager — and their view runs in decades. According to World Gold Council data, global central banks bought a net 244 tonnes of gold in Q1 2026 alone, up from 208 tonnes in Q4 2025. [World Gold Council, Gold Demand Trends Q1 2026, April 2026] China’s People’s Bank has added to its gold reserves for 19 straight months. These buyers did not sell on Wednesday when gold touched $3,964. They did not sell today either.
Paper traders price rate risk. Physical buyers absorb the selling. Every time prices fall, structural buyers step in — not to trade a Fed meeting, but because their job is to hold real assets that no government can freeze or debase.
That is the floor that kept gold above $3,900 this week.
Investor implication: When paper markets price in a risk, a data print that confirms rather than worsens that risk removes the marginal seller — not the structural buyer. Central banks buying 244 tonnes per quarter are not waiting for good news. They buy through it.
What Are the Major Banks Forecasting for Gold After Today’s PCE?
Bank forecasts have not shifted despite this week’s selloff. Goldman Sachs cut its year-end 2026 target to $4,900 per ounce on June 19 — down $500 after its economists removed all 2026 rate cuts from their model. [Goldman Sachs Global Research, June 19, 2026] JPMorgan held its $6,000 year-end target, arguing that central bank demand matters more than near-term rate moves. [J.P. Morgan Global Research, May 2026] Wells Fargo held its $6,100–$6,300 range.
Even Goldman’s revised floor sits well above today’s spot price near $4,028. The range of outcomes is wide, but the direction of the long-term case is not.
What Does Today’s PCE Mean If You Own Physical Gold?
If you hold physical gold, Wednesday’s selloff to $3,964 was a price on a screen — not a structural event. Your ounces carried no counterparty risk on Monday. They carry none today. Unlike paper gold, they cannot be margin-called, caught in fund redemptions, or moved by a Fed announcement.
That is not a reason to ignore how markets work. Knowing why gold sold off, why it recovered, and what the two-buyer split means for long-term prices is the kind of clarity that keeps holders steady when paper markets get loud.
Today’s PCE told a clear story: inflation is still hot at 4.1%, and the Fed is pointed in the same direction. The slow erosion of purchasing power that makes physical gold a sound long-term allocation has not paused. Paper markets needed a week to work through that. Physical markets barely moved.
Stay On Top of Gold & Silver Prices
Get important market alerts sent straight to your inbox.
SOURCES
1. Bureau of Economic Analysis — Personal Income and Outlays, May 2026
2. Federal Reserve — FOMC Statement and Summary of Economic Projections, June 17, 2026
3. CME Group — FedWatch Tool, June 2026
4. World Gold Council — Gold Demand Trends Q1 2026, April 2026
5. GoldSilver — Gold & Silver Spot Prices, June 25, 2026
6. CNBC — Core Inflation Rate Hit 3.4% in May, June 25, 2026
7. J.P. Morgan Global Research — Gold Price Predictions for 2026 and 2027
Disclaimer: This article is for informational purposes only and does not constitute financial or investment advice. Always consult a qualified financial adviser before making investment decisions.
You May Also like:
- 298 Tonnes of ETF Gold Is Underwater. Central Banks Aren’t.
- Hawkish Fed, Gold Below $4,000, Silver Below $60 — and a Market That Disagrees.
- Gold Just Broke $4,000. The Mainstream Called the Debasement Trade Dead. They’re Wrong.
- Two Things Are Hitting Gold Simultaneously. Only One Is About Gold.
- Why Is Silver Down 5%? The Gold-Silver Ratio Explains.
- BofA Says Three Rate Hikes. Silver Just Priced In the First One.
- Iran Deal. Oil Falling. A PM Out. Gold Still Above $4,100.