Published: 05-08-2026, 03:13 pm
Gold and oil have always told different stories about the economy. Gold rises when investors want protection. Oil rises when the economy is running hot. That distinction matters more than ever right now — and understanding it could change how you think about your portfolio.
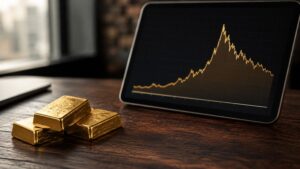
In early May 2026, gold was trading near $4,700 per ounce. Meanwhile, Brent crude had swung from $61 at the start of the year to an intraday high of $126, before pulling back toward $95. WTI peaked around $105–$113 over the same period, with the Brent-WTI spread widening to $25 per barrel as Middle East supply disruptions hit Europe and Asia harder than North America [U.S. Energy Information Administration]. In other words: two key commodities, moving in opposite directions, for completely different reasons.
That gold and oil inverse correlation is the story. Here’s what’s driving it.
Why Do Gold and Oil Prices Move in Opposite Directions?
The short answer: they respond to completely different things.
Oil is a risk asset. Its price tracks economic activity. When growth accelerates, energy demand rises and prices climb. When growth slows, demand falls and prices follow. Oil is also tied to the physical world — it gets used up, it’s subject to production quotas, and supply can be disrupted overnight by a pipeline outage or a geopolitical flashpoint.
Gold, by contrast, is a monetary asset. It doesn’t get consumed. It doesn’t run factories. Instead, it’s a store of value — what investors reach for when they stop trusting that paper assets will protect their purchasing power. As a result, gold rises when uncertainty climbs, inflation persists, currencies weaken, or the financial system shows stress.
Here’s the key: those conditions are usually the same ones that threaten economic growth — and therefore threaten oil demand. What pushes gold up tends to push oil down, and vice versa. Over the past five years, gold’s statistical correlation with crude oil sits at just -0.03 — effectively zero. That figure confirms the gold and oil inverse correlation operates at the structural level, not just in isolated episodes [FTSE Russell / LSEG].

Your Gold Buying Guide Most investors overpay when they buy gold. Then overpay again when they sell. This guide shows you exactly what to own — and why.
What Is the Gold-Oil Relationship?
The gold-oil relationship — sometimes called the gold-to-oil ratio or the inverse correlation between gold and oil — describes the tendency for the two to move in opposite directions during periods of economic stress or geopolitical tension. Specifically, when risk appetite is high and growth is strong, oil outperforms. When fear, inflation, and monetary uncertainty dominate, gold leads.
It’s not an ironclad rule. Both assets can rise together during commodity supercycles driven by global inflation. However, those periods tend to be brief. Once the inflationary spike fades, investors separate growth signals from safety signals — and the divergence reasserts itself.
What Drives the Divergence Between Gold and Oil?
Three forces matter most: the US dollar, monetary policy, and the specific character of a geopolitical shock.
The US dollar. Both commodities are priced in dollars, so a weaker dollar supports both. However, gold has a deeper inverse relationship with the dollar — it’s a hedge against dollar debasement itself. When confidence in the dollar erodes through inflation, deficit spending, or monetary uncertainty, gold benefits most. Oil benefits too, but ultimately its price anchors to energy supply and demand, not monetary confidence.
Monetary policy. Gold is highly sensitive to real interest rates — nominal rates adjusted for inflation. When real rates fall, the cost of holding a non-yielding asset like gold declines, making it more attractive. This has been a consistent driver for years. Notably, since 2022 gold has risen even as real rates stayed elevated — sustained instead by central bank buying and geopolitical risk [World Gold Council]. Oil, in contrast, responds to growth expectations. The rate cycle matters to it only insofar as tighter policy slows demand.
Geopolitical shocks. This is where the relationship gets counterintuitive. Not every conflict pushes gold and oil in opposite directions — it depends on the nature of the shock. Consider the Strait of Hormuz closure in early 2026. It sent Brent crude from $72 per barrel at the end of February to $118 by the end of Q1 — the largest quarterly increase on an inflation-adjusted basis since 1988 [U.S. Energy Information Administration]. Nevertheless, that same shock fuelled inflation fears and raised rate expectations. Consequently, it cut off the very conditions that benefit gold. Gold fell — not because it failed, but because an oil-driven inflation shock is a fundamentally different beast from a monetary crisis.
Is Gold a Better Inflation Hedge Than Oil?
Yes — and the difference comes down to what kind of inflation you’re hedging.
Oil spikes during supply-driven inflationary episodes, particularly when energy is the source of price pressure. However, oil is highly cyclical. It falls hard during the recessions that typically follow as central banks raise rates to cool things down. Hold oil through a full inflation-and-recession cycle and you often end up flat or worse.
Gold, on the other hand, hedges something deeper: monetary debasement. That’s the slow structural erosion of purchasing power through money-printing and deficit spending. It’s the kind that doesn’t show up loudly in a single quarter but compounds quietly over decades. Physical gold has preserved purchasing power across centuries because it can’t be printed, inflated away, or defaulted on.
Central banks understand this distinction and act on it. From 2022 to 2024, net central bank gold purchases surpassed 1,000 tonnes annually. That figure is roughly twice the prior decade’s average of 473 tonnes per year. China, India, Poland, and Turkey were among the most active buyers, treating gold as a long-term reserve asset rather than a short-term inflation trade [World Gold Council]. Furthermore, China’s central bank bought for 15 consecutive months through January 2026. Sovereign institutions with century-long time horizons don’t accumulate something on a whim.
How Do Gold and Oil Supply and Demand Differ?
Oil supply and demand are tightly coupled to the short term. OPEC+ decisions, US shale output, weekly inventory data, and geopolitical disruptions all move prices within days or weeks. For example, when the IEA estimated in May 2026 that the ongoing conflict was disrupting roughly 14 million barrels per day of global oil supply, markets reacted within hours [Trading Economics]. That responsiveness is useful as an economic barometer. At the same time, it makes oil highly volatile and hard to hold through prolonged uncertainty.
Gold’s supply picture is almost the opposite. Mine supply grows at just 1–2% per year. The stock of above-ground gold is enormous relative to annual production, and new supply is a small fraction of what’s already in the market. As a result, gold prices move far more in response to investment demand and monetary conditions than to shifts in physical supply.
That investment demand has been formidable in recent years. Global gold ETF holdings grew by more than 800 tonnes in 2025 — reversing roughly three years of net outflows from 2021 through 2023 — and hit a record 4,025 tonnes by year-end. Moreover, in Q3 2025 alone, combined investor and central bank demand totalled approximately 980 tonnes, more than 50% above the average of the previous four quarters [J.P. Morgan Global Research]. Supply constraints don’t drive gold. Conviction does.
Does It Matter Which Commodity You Hold?
Gold and oil are not interchangeable — and treating them as if they are is one of the more costly mistakes in commodity investing.
Oil held as an “inflation hedge” is really a growth-sensitive, supply-disruption-sensitive risk asset. It works during inflationary periods only when energy is the driver. That’s narrow. Gold, however, hedges the monetary conditions underneath inflation — the debasement, fiscal deterioration, and loss of purchasing power — regardless of where price pressure originates.
Additionally, gold’s correlation with equities is low. Its correlation with oil is effectively zero. When financial stress peaks, it tends to hold or rise precisely when most other assets are falling. That’s the portfolio role oil can never play.
The 2026 episode made this concrete. When the Hormuz closure turned oil into an inflation engine, gold fell roughly 16% from its January 29 all-time high of $5,595. The oil shock raised rate expectations and froze the Federal Reserve. The gold and oil inverse correlation ran in reverse during the acute phase.
Then, however, peace negotiations eased oil prices. The rate-cut path reopened, and gold bounced back toward $4,700. It remained up approximately 41% year-over-year. The floor held.
Goldman Sachs holds a year-end 2026 target of $5,400. J.P. Morgan targets $6,300. Morgan Stanley forecasts $5,200 for the second half of the year [Morgan Stanley]. Three major banks, all expecting the structural tailwinds to reassert themselves once the inflation pressure lifts.
Stay On Top of Gold & Silver Prices
Get important market alerts sent straight to your inbox.
People Also Ask
Why do gold and oil prices often move in opposite directions?
Gold is a monetary asset that rises during uncertainty, inflation, and financial stress. Oil, in contrast, is a risk asset tied to economic growth and energy demand. The conditions that push gold higher — fear, currency debasement, monetary instability — are often the same ones that slow economic activity and reduce oil demand. That divergence is structural, not coincidental.
How does the gold-oil inverse relationship affect investment strategy?
Gold and oil serve different portfolio functions and can’t substitute for each other. Specifically, gold provides long-term purchasing power protection with low correlation to financial stress events. Oil, by contrast, provides cyclical growth exposure. Genuine monetary protection requires gold — oil won’t deliver it across a full economic cycle.
What economic factors influence the gold-oil price correlation?
Three main drivers shape the relationship: the US dollar, real interest rates, and economic growth expectations. A weaker dollar and lower real rates favour gold. Strong growth and rising energy demand favour oil. During oil-driven inflation spikes, both can move together briefly. However, the structural divergence tends to reassert itself once that shock passes.
Is gold a better hedge against inflation than oil?
Yes, for monetary inflation specifically. Oil spikes during supply-driven episodes, but falls sharply when the recession arrives. Gold, however, hedges the deeper monetary debasement — the slow erosion of purchasing power through money-printing and deficit spending — that compounds over decades. Central banks buying gold consistently rather than oil confirms this distinction at the institutional level.
What role does geopolitics play in driving gold and oil apart?
It depends on the type of shock. Supply disruptions in oil-producing regions spike oil prices fast. However, when that disruption triggers inflation fears and delays rate cuts, it can actually suppress gold by keeping real yields elevated. The 2026 Middle East conflict demonstrated exactly this: Brent surged from $72 to $118/bbl by the end of Q1, while gold fell roughly 16% from its January record. Once oil eases and rate-cut expectations return, gold’s structural drivers take over again.
So Which One Actually Protects You?
Oil tells you where the economy is going. Gold tells you whether your money will hold its value when it gets there. The 2026 Hormuz episode stress-tested that distinction — and the result confirmed it. When oil drove inflation higher and froze the Fed, gold pulled back. However, the moment oil eased and rate cuts came back into view, gold reasserted itself. It fell 16% from its January record. Nevertheless, it’s still up 41% over the past year. The structural case — central bank buying, dollar debasement, fiscal pressure — didn’t change.
If holding the monetary asset rather than the energy commodity makes sense to you, opening an account at GoldSilver.com is how you get started.
SOURCES
1. U.S. Energy Information Administration — Crude oil and petroleum product prices increased sharply in Q1 2026
2. FTSE Russell / LSEG — Gold in a Fragmented World: Safe Haven and Strategic Asset
3. World Gold Council — Are Fiscal Concerns Driving Gold?
4. World Gold Council — Central Bank Gold Reserves by Country
5. Trading Economics — Crude Oil Price Chart, Historical Data and News
6. J.P. Morgan Global Research — Gold Price Predictions and Outlook
7. Morgan Stanley — Gold’s Safe-Haven Status Faces a Reality Check as Prices Fall
Disclaimer: This article is for informational and educational purposes only. It does not constitute investment advice. Please consult a qualified financial adviser before making any investment decisions.
You may also like:
- 7 Timeless Warren Buffett Rules for Gold & Silver Investors
- Gold vs. Bitcoin: Which Hard Asset Will Protect Your Wealth?
- Why Central Banks Sell Gold — And What It Means for Prices
- Why Gold Deserves a Permanent Spot in Your Portfolio
- Silver vs. Gold: A Clear 5-Year Investment Guide (2026–2031)
- $5,500 Gold by Q1 2027? The Central Bank Risk Driving It
- Why Gold Stabilizes — and Silver Amplifies
- COMEX Silver Coverage Ratio: Is Your Paper Silver Real?