If you’ve been watching the gold market lately, you’ve probably noticed that institutional language around the metal has shifted. Gold is increasingly described not as a crisis hedge but as a core portfolio holding — and the research coming out of major banks reflects that.
J.P. Morgan’s latest gold outlook is a case in point. The bank has published one of the more detailed and structurally grounded gold forecasts on Wall Street this cycle, and while price targets tend to grab the headlines, the more consequential part of the report is the reasoning behind them.
Here’s what the forecast says, what’s driving it, and how analysts are thinking about portfolio positioning.
What Is J.P. Morgan’s Gold Price Forecast for 2026?
J.P. Morgan now forecasts gold reaching $6,300 per ounce by end of 2026, an upward revision from an earlier base case that had prices averaging around $5,055 by Q4 2026 and climbing toward $5,400 in 2027.
The bank also modeled an upside scenario: if household gold allocations rise from roughly 3% of assets under management to around 4.6%, gold could trade between $8,000 and $8,500 per ounce. That’s not their base case, but the willingness to model it at all reflects how meaningfully the demand picture has changed.
What’s notable is that even after gold’s sharp 9.8% single-session drop on January 30, 2026 — its worst day since 1983 — J.P. Morgan maintained its bullish outlook, characterizing the move as positioning-driven rather than a fundamental shift.
The Financial System Isn’t Safer — And You Know It As risks mount, see why gold and silver are projected to keep shining in 2026 and beyond.
What’s Driving J.P. Morgan’s Bullish Conviction?
J.P. Morgan’s outlook is grounded in three structural forces reshaping global markets.
Central bank buying. The bank expects central bank purchases to remain elevated in 2026, extending a multi-year trend of reserve diversification away from U.S. dollar–denominated assets. According to the World Gold Council, annual central bank gold buying has recently ranged near historic highs, reinforcing long-term structural demand.
Investor demand. J.P. Morgan also anticipates continued participation from investors, including renewed inflows into gold-backed ETFs and steady bar and coin demand. Retail investment demand has remained resilient in recent years, particularly during periods of macro uncertainty.
Macro tailwinds for real assets. The bank describes the current backdrop as supportive of real assets, citing geopolitical tensions, persistent fiscal deficits, and evolving monetary policy expectations. In environments where confidence in fiat systems weakens, gold has historically benefited from its role as a non-yielding but scarce monetary asset.
How Should You Allocate Gold in Your Portfolio in 2026?
This is where forecasts meet practical decisions — and where opinions vary more than price targets suggest.
There’s no universal answer. Portfolio allocation depends heavily on individual risk tolerance, time horizon, and what role gold is meant to play alongside equities, fixed income, and other holdings. That said, most financial strategists working in this space cluster around a few broad frameworks.
Wealth preservation–focused portfolios tend to run higher gold allocations — often in the 8–10% range — with a smaller silver component around 2–3%. The emphasis is on long-term purchasing power protection and reducing exposure to currency debasement.
Balanced portfolios typically allocate 5–8% to gold and 3–5% to silver, attempting to capture gold’s defensive characteristics while incorporating silver’s dual role as both a monetary and industrial metal.
Growth-oriented or higher-risk portfolios sometimes run lower gold exposure (3–5%) and larger silver positions (7–10%), accepting more volatility in exchange for potential upside.
Across these approaches, most practitioners suggest keeping total precious metals exposure somewhere between 5% and 15% of a diversified portfolio — a range broad enough to accommodate different views but narrow enough to be meaningful.
What’s worth noting is that J.P. Morgan’s upside scenario is essentially built on a relatively modest shift in household allocations: from around 3% to 4.6%. That’s not a dramatic reallocation — it’s a marginal adjustment at scale.
Gold as a Hedge Against Inflation: Does It Still Work in 2026?
Gold doesn’t move perfectly with inflation month to month. But over multi-year periods, it has historically preserved purchasing power far more effectively than fiat currency.
When central banks expand the money supply or governments run persistent deficits, currency purchasing power erodes. Gold’s limited supply and global acceptance make it structurally resistant to that erosion.
Recent years illustrate this dynamic:
- In 2020, gold rose more than 25% amid aggressive monetary expansion.
- In 2023, it gained over 13% despite elevated interest rates.
The lesson: gold often responds not just to inflation data, but to systemic risk and monetary credibility.
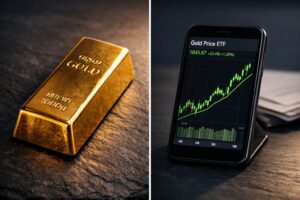
Physical Gold vs. ETFs: How Should Investors Think About It?
J.P. Morgan’s thesis emphasizes physical demand — central bank purchases, bar and coin buying, and ETF-backed holdings. That distinction matters when deciding how to implement your gold exposure.
Physical gold — coins and bars held in direct ownership — eliminates counterparty risk. There’s no intermediary, no fund structure, no dependence on a third party’s solvency. For investors whose primary concern is systemic risk or long-term wealth preservation, that characteristic is meaningful.
Gold ETFs offer price exposure without the logistics of storage and insurance. They trade like equities, provide liquidity, and integrate easily into brokerage accounts. For investors managing tactical positioning or making frequent adjustments, they’re a more practical vehicle.
Mining stocks occupy a different category entirely. They’re operating businesses, with cost structures, management decisions, and geopolitical exposure layered on top of the gold price itself. That can amplify returns in a rising market — but it also introduces risks that don’t exist with direct metal ownership.
There isn’t a one-size-fits-all answer. Many investors use a combination approach: physical gold for long-term wealth preservation, and ETFs or related securities for tactical positioning within a broader portfolio strategy.
Gold Market Outlook 2026: Key Risks to Watch
J.P. Morgan’s bullish case isn’t unconditional. The January 30 selloff was a useful reminder that even structurally supported markets can experience violent short-term dislocations — particularly when leveraged positions unwind quickly.
The risks to watch include an unexpected pullback in central bank buying, a reversal in ETF inflows, or a sharp dollar rally. Any of these could suppress prices in the short term without necessarily changing the longer-term demand picture.
For that reason, most analysts who favor gold exposure recommend building it gradually rather than concentrating purchases around particular price levels. Dollar-cost averaging — buying consistent amounts at regular intervals — reduces the risk of poor timing and smooths out volatility-driven entry points.
Bottom Line: What This Means for Investors
J.P. Morgan’s projections reflect more than a price target. They signal a broader institutional shift toward treating gold as a core portfolio component.
If your current allocation to gold is below 5%, you may be underexposed relative to what many institutions are modeling as prudent.
Revisiting your gold portfolio allocation 2026 strategy now — before volatility forces reactive decisions — allows you to build exposure methodically and intentionally.
Gold’s role in modern portfolios has evolved. The data suggests the market is beginning to price that reality in.
Investing in Physical Metals Made Easy

People Also Ask
What is J.P. Morgan’s gold price forecast for 2026?
J.P. Morgan’s base case projects gold averaging $5,055 per ounce by Q4 2026. In February 2026, the bank revised its year-end target upward to $6,300 per ounce, citing sustained central bank and investor demand. An upside scenario of $8,000–$8,500 per ounce is also on the table if household gold allocations rise from ~3% to 4.6% of assets.
What percentage of my portfolio should be in gold in 2026?
Many institutional strategists suggest allocating between 5% and 15% of a diversified portfolio to precious metals, depending on risk tolerance and financial goals. Conservative investors may lean toward higher gold allocations for wealth preservation, while more growth-oriented investors may balance gold with silver or other assets. The right allocation ultimately depends on your time horizon and overall portfolio strategy.
What is driving gold prices higher in 2026?
Three structural forces are driving gold’s 2026 rally: central bank reserve diversification (J.P. Morgan forecasts 800 tonnes of central bank purchases this year), robust ETF inflows (~250 tonnes projected), and strong retail bar and coin demand expected to exceed 1,200 tonnes annually. Geopolitical uncertainty and fiscal deficits are adding further tailwinds.
Is gold still a good hedge against inflation in 2026?
Gold does not track inflation perfectly in the short term, but over longer cycles it has historically preserved purchasing power more effectively than fiat currency. During periods of monetary expansion, rising debt levels, or declining currency confidence, gold has often acted as a stabilizing asset within diversified portfolios.
Should I buy physical gold or a gold ETF in 2026?
It depends on your priorities. Physical gold eliminates counterparty risk entirely and gives you direct ownership, making it ideal for investors concerned about systemic financial risk. Gold ETFs backed by physical metal offer similar price exposure with greater liquidity and no storage costs. For most investors, a combination of both—physical gold for long-term security and ETFs for tactical flexibility—aligns best with J.P. Morgan’s structural demand thesis.
Disclaimer: This article is for informational purposes only and does not constitute investment advice. Always consult a qualified financial advisor before making investment decisions. Past performance is not indicative of future results.
You May Also Like:
- How Government Debt Affects Gold and Silver
- Gold vs Silver: The Liquidity Difference That Matters
- Silver Price Components: Premium, Spot, and Dealer Markup Explained
- Silver Price Forecasts Revisited: Why Wall Street Got It Wrong
- Gold’s Purchasing Power: What One Ounce Buys Over Time
- Why Metals Dominated Every Asset Class in 2025 [and What It Means for 2026]