Gold Is Down 25%. Morgan Stanley Says One Number Unlocks $5,200.

Gold hit $5,589 in January. Today it’s at $4,177. Morgan Stanley says the structural case for $5,200 is intact — but one specific buyer type hasn’t shown up yet. Here’s the chain that explains why, and what turns it back on.
Gold Down 26%. Barclays’ $4,791 Target Never Moved.

Barclays held its $4,791 gold target through a 26% correction. Here’s the fair-value framework behind that call — and what it means for gold investors today.
How Central Banks Decide How Much Gold to Hold
The World Gold Council’s 2026 survey asked 76 central banks how they decide how much gold to hold. The answer comes down to three objectives: safety, liquidity, and return — in that order. Here’s what that framework looks like in practice, why a record 45% of central banks plan to increase their allocation this year, and why the same logic applies to individual investors.
Five Signals That Say Gold’s Correction Is a Reset, Not a Reversal
Gold is down 22% from its January high. But five signals published this week — a record central bank survey, a major bank holding its $4,900 target, and independent research confirming the structural drivers are undamaged — say the correction was positioning, not a thesis break.
Wall Street’s $6,000 gold call rests on data most investors never see

Wall Street’s $6,000 gold forecast isn’t built on the price target — it’s built on a central bank buying figure most investors never see. Official IMF data shows 16 tons of net purchases in Q1 2026. The World Gold Council estimates the real figure at 244 tons. That gap is the story.
Gold Slides to $4,130 as Iran War Turns Inflation Against It

War is supposed to lift gold. This war is different. The Iran conflict is driving oil up, stoking inflation, and forcing the Fed toward rate hikes — the one thing gold cannot afford.
Why Is Gold Still a Safe Haven? Switzerland’s Biggest Refiner Just Answered.

Valcambi’s incoming CEO processed 1,000 tonnes of gold last year for national banks and bullion traders. Here’s the institutional case for why gold remains a strategic safe haven in 2026 — and what central bank behavior reveals about where the global monetary system is heading.
Gold at $4,454 Says the Fed Is Trapped. Here’s Why.
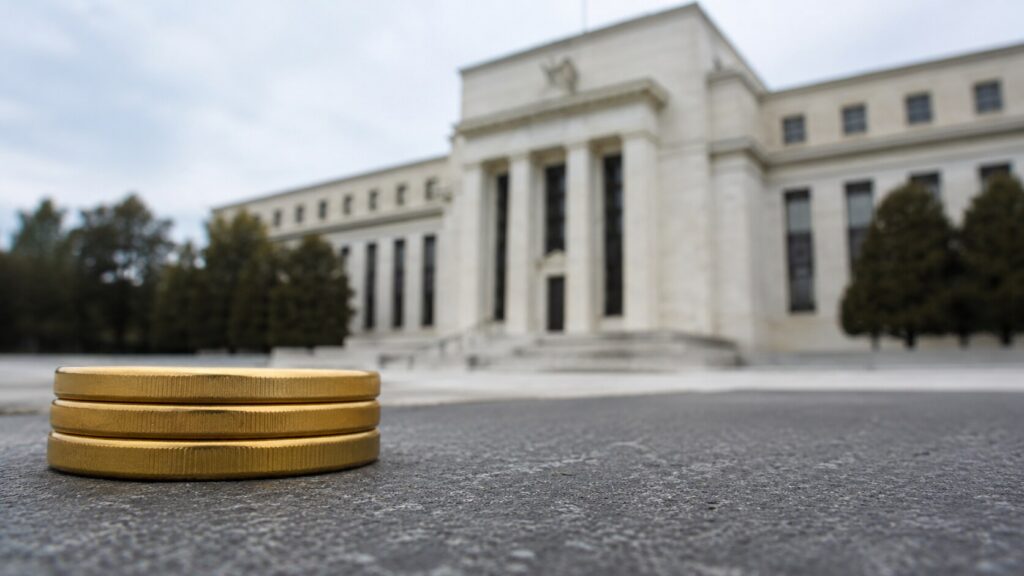
Friday’s jobs report doesn’t just move gold for 48 hours. This time it sets the stage for Kevin Warsh’s first FOMC meeting, a divided committee, and 3.8 percent inflation the Fed can’t cut through. Three scenarios. One structural trap. Here’s the framework before the number drops.
Gold Price History: From $35 to $4,500 in 100 Years
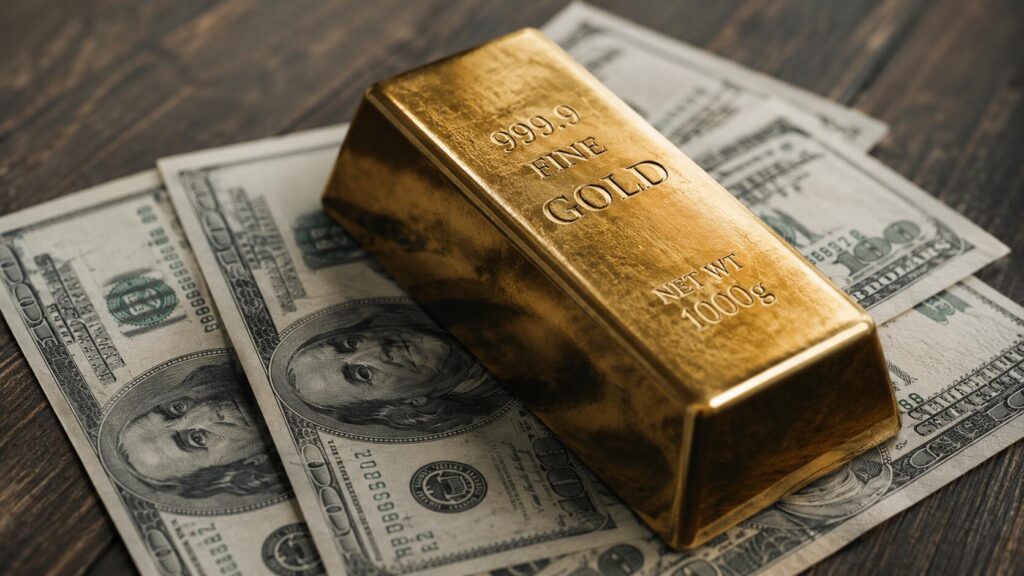
Gold went from $35 in 1971 to around $4,500 today — a 12,000% gain since the gold standard ended. Meanwhile, the dollar lost 96.9% of its purchasing power over the same period. These are not two separate stories. This is the complete gold price history: decade by decade, the real cause behind every major move, and what a century of data tells investors right now.
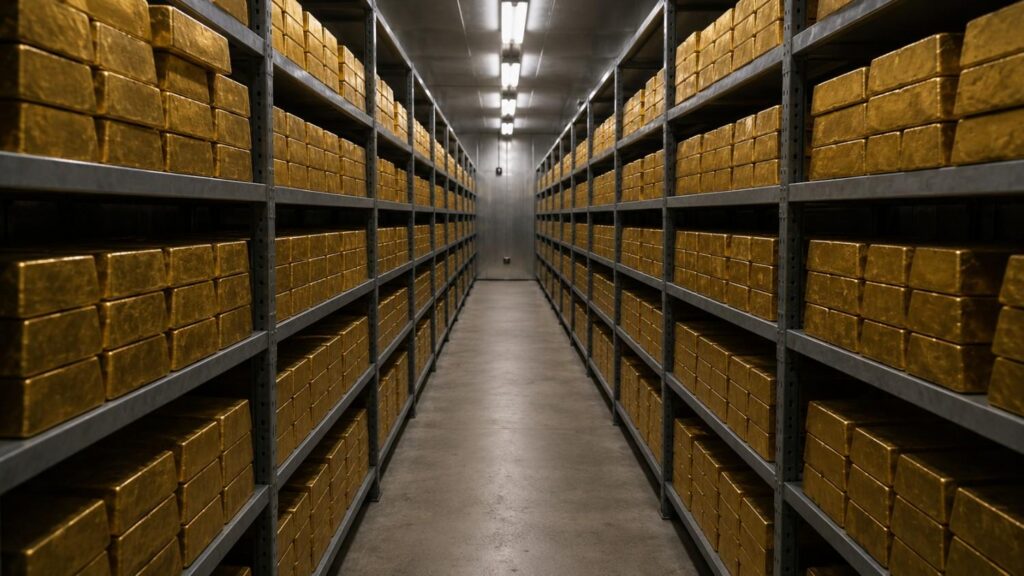
Gold at $4,500: What Fort Knox, China, and Silver Are Telling You
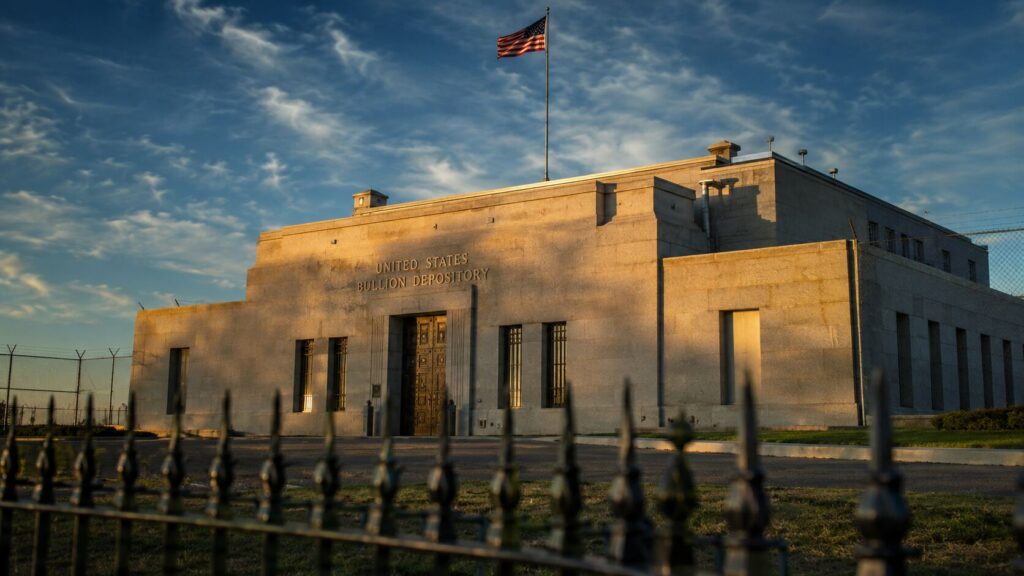
Fort Knox holds $662 billion in gold not independently audited since 1953. China has bought gold for 13 straight months. Manufacturers are signaling inflation isn’t finished. Fourteen states just made gold and silver constitutional money. And silver is outperforming gold 2:1 today. Five stories. One through-line. Here’s what they mean for your metals.
