Gold vs. Savings Account: Which One Is Actually Beating Inflation Right Now?

With inflation at 4.2% and the national average savings rate at 0.38%, your savings account is earning a real return of approximately negative 3.8% per year. This article explains what a savings account and gold each actually do — and which one is built for the job of protecting your purchasing power over the long term.
Seigniorage: The Hidden Tax on Every Dollar You Hold
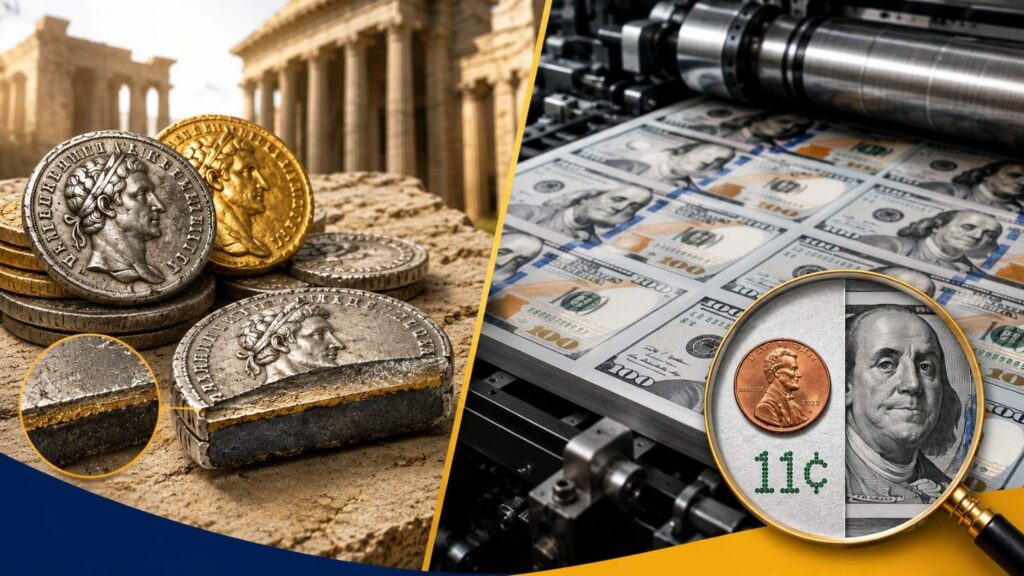
Every time a government issues currency, it pockets the difference between face value and production cost. It’s called seigniorage. Here’s how it works, why it always ends in inflation, and why gold is the only asset that can’t be debased.
Q1 GDP Beat. Jobless Claims Beat. Gold Rose. Here’s Why.
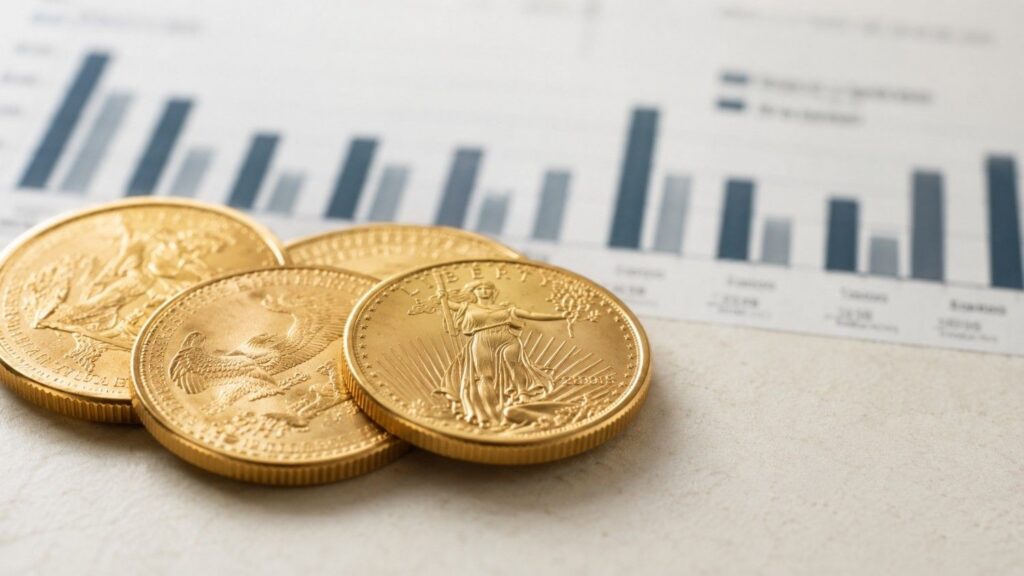
Strong GDP data is actually bad news for gold’s paper price. When the economy grows faster than expected, the Federal Reserve gains permission to raise interest rates — and higher rates increase the cost of holding non-yielding assets like gold. Here’s the mechanism, what June 25’s triple data release confirmed, and what it leaves unchanged for long-term holders.
PCE Drops Thursday. Here’s What It Means for Gold.
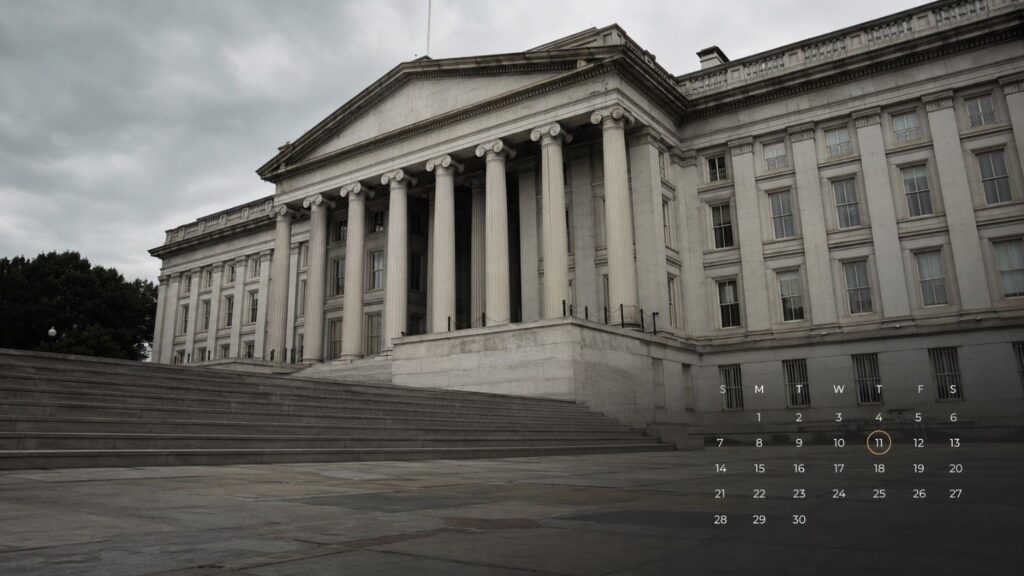
The Fed doesn’t watch CPI. It watches PCE — and the May reading drops Thursday, June 25. Here’s the mechanism linking this one number to gold prices, rate-hike odds, and what long-term holders need to understand before the week is out.
TIPS Protect Against Inflation. Gold Protects Against More.

TIPS and gold both claim to hedge inflation — but they work through opposite mechanisms and fail in different scenarios. Here is the honest comparison every long-term investor needs to understand.
Gold Holds $4,481 With Rate Hike Risk Rising. Here’s the NFP Decision Map.

Gold is holding near $4,481 with rate hike risk rising — a divergence that, in any prior rate cycle, would have already sent gold lower. Tomorrow’s May jobs report is the last major data point before Warsh’s first FOMC meeting June 16–17. Here’s the three-scenario decision map: what a hot print, an in-line print, and a soft miss each mean for gold — and why the Fed’s policy trap makes the structural case for sound money regardless of Friday’s number.
Rate Hike Odds Just Hit 85%. Gold Is Up. Here’s Why.
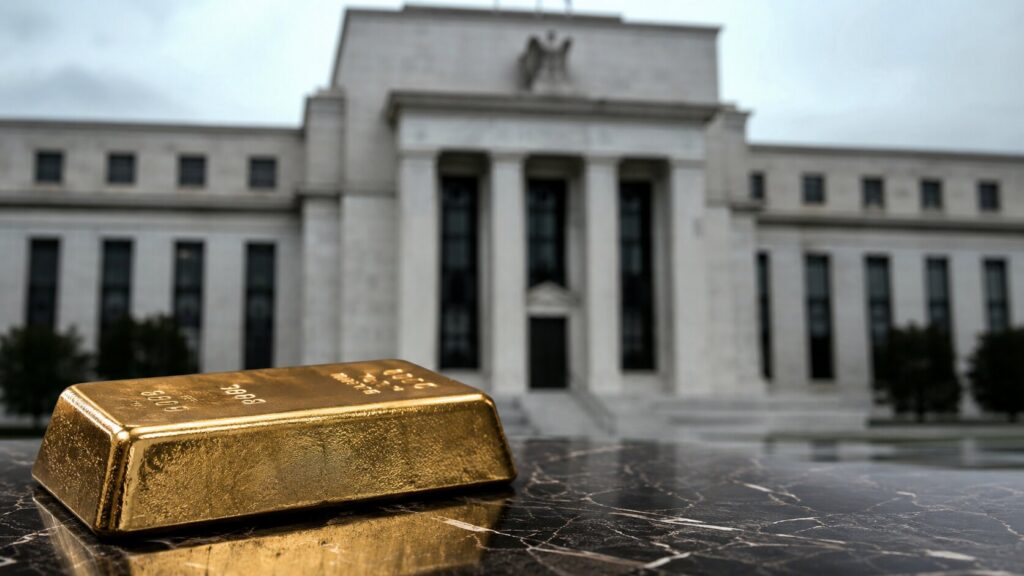
Rate hike odds just hit 85%. Gold is up anyway. Most headlines won’t explain why — because the answer requires flipping the standard model upside down. The number that actually drives gold isn’t the fed funds rate. It’s the real yield. Here’s the mechanism.
Gold Surges 1.5%: ADP, ISM, and Beige Book Trap the Fed

Five data points landed Wednesday that should have pressured gold. Instead, gold surged 1.5%. Each event tightens the same Fed trap — and gold trades on the trap, not the direction the Fed falls.
Factory Costs Hit 82.1. That Number Is Now Working for Your Gold.

The ISM Manufacturing Prices-Paid Index hit 82.1 in May — the second-highest reading since 2022 and the 20th consecutive month of rising factory costs. Most headlines covered the manufacturing boom. Almost nobody explained what the prices-paid number means for the Fed, for inflation this summer, and for the structural case for holding gold.
Gold Price History: From $35 to $4,500 in 100 Years
Gold went from $35 in 1971 to around $4,500 today — a 12,000% gain since the gold standard ended. Meanwhile, the dollar lost 96.9% of its purchasing power over the same period. These are not two separate stories. This is the complete gold price history: decade by decade, the real cause behind every major move, and what a century of data tells investors right now.
