Published: 04-14-2026, 05:01 pm | Updated: 04-14-2026, 05:53 pm
At midnight Eastern Time on April 18, the Federal Reserve enters the FOMC blackout period. For 12 days, through April 30, no Fed official can speak publicly on monetary policy. No speeches, No interviews, No calibrated signals about what the committee is thinking. In a market that has spent seven weeks trading almost entirely on rate expectations, that silence carries real weight.
What Is the FOMC Blackout Period?
Eight times a year, the Fed imposes a communications blackout ahead of each scheduled FOMC meeting. Starting the second Saturday before the meeting, officials and staff stop making public statements on monetary policy. The silence holds until the day after the decision. This time: April 18 through April 30, with the rate decision on April 29.
The logic is sound. The Fed doesn’t want a stray comment from a regional president moving markets days before a major decision. Better to let the data speak.
That discipline is fine in ordinary times. Now, however, isn’t ordinary times.
Why Does the April 2026 Blackout Matter More Than Usual?
Three forces make this blackout unusually consequential for gold. Rate-cut expectations have collapsed to near zero. Stagflation data is now confirmed. And the Iran ceasefire is fragile — with no Fed officials available to recalibrate markets for 12 days.

The Edge Every Investor Needs Smarter precious metals investing starts here. The Nuggets Newsletter brings you essential market insights, Fed updates, global trends, educational videos, and much more.
Have Rate-Cut Expectations Already Collapsed?
Completely. Before the Iran war, futures markets were pricing roughly 58 basis points of Fed cuts in 2026 — more than two full cuts. That number is now effectively zero. CME FedWatch puts the probability of a hold at the April 29 meeting at 94.8%. Odds of any cut by year-end: ~21%, down from 40% just a month ago.
When rate-cut expectations rise, gold’s opportunity cost falls — and its price tends to follow. The past four weeks have been a live demonstration of the reverse. Gold at $4,760 is still 10% below where it traded before the war began.
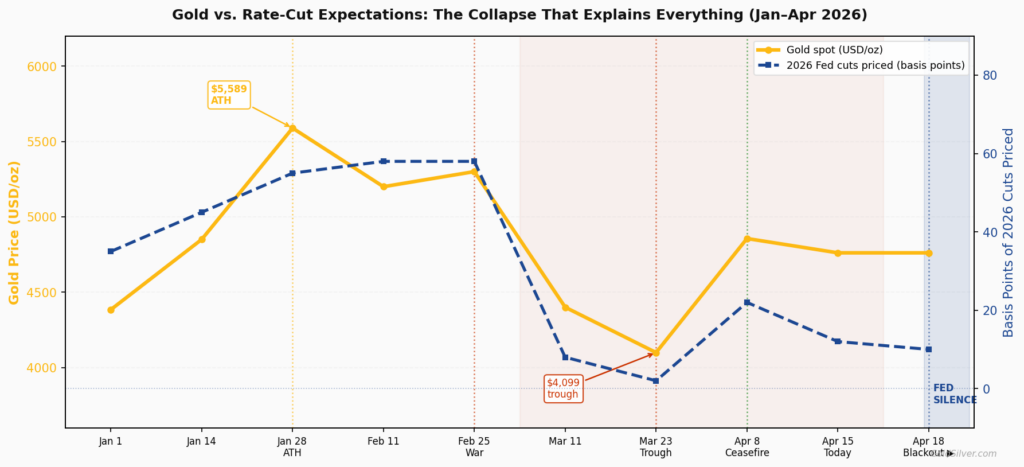
Gold price vs Fed rate-cut expectations, January–April 2026, showing how gold fell as cut expectations collapsed from 58bp to near zero after the Iran war began.
Is Stagflation Now Confirmed?
Yes. March CPI printed at 3.3% year-over-year — the highest since May 2024 — while Q4 GDP was revised down to 0.5%. Inflation too hot to cut, and growth too weak to hike. The Fed’s impossible position is now in the official data, not just the forecasts.
When March CPI landed, Powell could address it publicly. During the blackout, any comparable surprise gets interpreted by markets alone — no official framing, no context, nothing to absorb the shock.
Is the Iran Ceasefire Still in Place?
Nominally, yes. The two-week US-Iran truce brokered by Pakistan on April 8 remains technically active. But weekend talks in Islamabad collapsed after 21 hours, and the US Navy began blocking Iranian ports on April 13.
A durable ceasefire eases oil, cools inflation fears, revives rate-cut expectations, and opens a path back toward $5,000 for gold. A breakdown sends oil above $100 again, reignites hike fears, and extends gold’s consolidation. Neither outcome will have a Fed voice to frame it during the blackout.
What Should Investors Watch During the 12-Day Blackout?
Oil is the first thing to watch. Brent crude around $100 is where the market is balanced right now. Above $105, rate-hike fears re-emerge and pressure gold. Below $90, cut expectations revive and gold gets a tailwind.
The ceasefire is the wild card. Resumed strikes, Hormuz disruptions, or a breakdown in talks — any of these pushes oil higher and gold lower. Genuine diplomatic progress reverses the trade, fast.
Incoming data is the third lever. The import price index also lands April 16, alongside China’s industrial figures. Together, they’ll paint the clearest picture of where inflation is heading. Markets will be pricing that picture without any Fed guidance to temper the reaction.
Does the Blackout Change the Structural Case for Gold?
Central banks have been buying gold at historically elevated rates for three consecutive years. The US is paying $88 billion a month in interest on its debt. The dollar’s share of global reserves has been declining for a decade. These are multi-year structural forces. They don’t pause for a 12-day communications window.
Gold’s January all-time high of $5,589 reflected those forces. The current pullback to $4,760 reflects a specific, temporary mechanism: an oil-driven inflation shock that killed rate-cut expectations. When that mechanism resolves — ceasefire, peak oil, a Fed pivot — the structural bid reasserts.
The blackout is a technical feature of the Fed’s calendar. It removes a short-term stabilizer at an unusually unstable moment. Worth knowing, but worth losing sleep over.
Stay On Top of Gold & Silver Prices
Get important market alerts sent straight to your inbox.
SOURCES
1. Philadelphia Fed — FOMC Blackout Period Calendar
2. CME Group — FedWatch Tool
3. CNBC — Gold Subdued as Dollar Firms in Wake of Failed Peace Talks, Blockade of Iran
4. State Street Global Advisors — Monthly Gold Monitor, April 2026
5. Fox Business — Federal Reserve Projects Only One Rate Cut for 2026
6. TradingEconomics — Gold Price Chart and Historical Data
7. GoldSilver.com — Gold Price Forecasts for 2026, Revisited After Q1
8. FinancialContent — Oil Shock Jolts Inflation: March CPI Hits 3.3%
9. GoldSilver.com — Stagflation and Gold: Why the Selloff Doesn’t Tell the Whole Story
10. FinancialContent — PPI Inflation Watch: Markets Await Data to Assess Energy Cost Pressures
11. Federal Reserve — Beige Book
12. World Gold Council — Gold Demand Trends
13. OnlineGold.org — Central Banks Added 1,200 Tonnes in 2025
14. CNBC — A Fragile US-Iran Ceasefire Sparks Market Relief
15. Euronews — Stock Markets Gain and Oil Falls on Hopes of Renewed US-Iran Talks
16. IMF — Currency Composition of Official Foreign Exchange Reserves (COFER)
By the GoldSilver Editorial Team — helping investors understand sound money since 2005. This article is for informational purposes only and does not constitute financial, investment, or tax advice. Always consult a qualified financial advisor before making investment decisions.
You May Also Like
- Gold Is Down 10% From Its War-Peak — and Still Up 46% in a Year
- Gold Outranks the Dollar at Central Banks — What It Means for Your Savings
- Hormuz Blockade Sent Gold Down 2%. Here’s Why That’s Bullish
- Gold Jumps 2% as Trump Plans Iran War Address Tonight
- $88 Billion a Month: Why U.S. Debt Is Driving Gold Prices
- CPI Hits 3.3%, GDP Stalls — Is Stagflation 2026 Here?
- War Risk, Stagflation Signals, and a $6,300 Gold Target