Published: 04-17-2026, 10:24 am
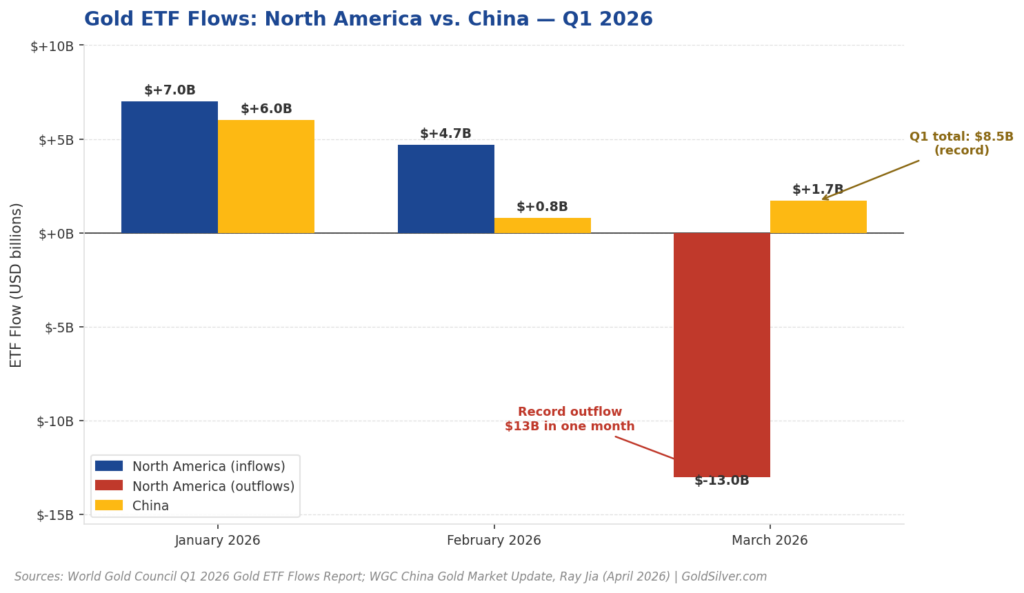
In Q1 2026, North American investors pulled $13 billion out of physically backed gold ETFs. That was the largest monthly outflow ever recorded for the region, per the World Gold Council. In the same quarter, Chinese investors put a record $8.5 billion in. The same metal. The same price. Opposite flows.
Gold is trading at $4,879 per ounce this morning — roughly around17% above its mid-March lows.
Why Did North American Gold ETF Outflows Hit a Record in March 2026?
The $13 billion outflow had one cause: the Federal Reserve’s pivot away from rate cuts. When the US-Israel strikes on Iran began on February 28, oil prices spiked and inflation expectations jumped. The market had been pricing in two or more Fed cuts in 2026. It rapidly repriced to a hold — with some brief moments when futures implied a small probability of a hike.
That shift matters for gold directly. Gold pays no interest. It competes with yield-bearing assets. When real interest rates rise — nominal rates minus inflation expectations — holding gold becomes more expensive relative to holding Treasuries. US institutional investors who owned gold as an interest rate hedge did what the trade required: they sold.
The outflow wasn’t panic. It was mechanical. And it ended a nine-month North American inflow streak, per the World Gold Council. The historical parallel is useful: the fourth-, fifth-, and sixth-largest monthly outflows on record all occurred during the COVID-19 period. Each was followed by a strong recovery in flows within 6 to 12 months, once real rates eased and the Fed pivoted back.

The Edge Every Investor Needs Smarter precious metals investing starts here. The Nuggets Newsletter brings you essential market insights, Fed updates, global trends, educational videos, and much more.
Why Is China Buying Record Amounts of Gold?
Chinese gold ETF inflows reached $8.5 billion in Q1 2026 — a quarterly record — according to World Gold Council research head Ray Jia. Holdings rose 50 tonnes to 298 tonnes. Assets under management climbed 26% to $44 billion, the highest quarter-end total in the history of the Chinese gold ETF market.
China’s CSI 300 equity index fell in March as the Iran war disrupted supply chains. The dollar surged after the February 28 strikes, briefly making hard assets more attractive. Safe-haven demand built as the Strait of Hormuz closure tightened global energy supply.
The more telling detail is the timing, not the size. Chinese investors bought more as prices fell in March, not less. That’s the opposite of how rate-sensitive Western investors behaved. It signals a different investment thesis entirely: gold as a permanent monetary holding, not a position to trim when the Fed turns hawkish.
China’s Q1 2026 GDP, released yesterday by the National Bureau of Statistics, came in at 5.0% — beating the 4.8% consensus and accelerating from 4.5% in Q4 2025. A growing economy buying record gold at elevated prices isn’t a distress trade. It’s a conviction trade.
What Does the East-West Divergence Actually Tell Us?
State Street Global Advisors confirmed the split independently. Their April 2026 Monthly Gold Monitor shows mainland China gold ETF inflows of $8.1 billion year-to-date — versus over $2 billion in outflows from the US gold ETF sector over the same period. (The difference from the WGC’s $8.5 billion reflects methodology: State Street tracks a narrower fund set.)
The same asset, two large markets, mirror-image behavior. So: are US investors wrong, or just early?
The People’s Bank of China makes the structural case harder to dismiss. The PBOC has purchased gold for 17 consecutive months, bringing official holdings to 2,313 tonnes — 9% of China’s total foreign exchange reserves, per the World Gold Council. Central banks don’t trade around rate cycles. The PBOC’s buying says: we want more gold regardless of what the Fed does this quarter. That kind of institutional conviction creates a floor that short-term rate moves cannot remove.
Have US Gold ETF Outflow Streaks Reversed Before?
Every major US gold ETF outflow streak in recent decades has reversed within 6 to 12 months. The COVID-19-era outflows — the fourth, fifth, and sixth largest on record — each unwound within roughly a year. The Global Financial Crisis streak resolved the same way. In each case, the reversal came when real rates fell back and the Fed turned accommodative again.
Gold’s mid-March 2026 low was approximately $4,100. At around $4879 today, it has already recovered 17%. The sellers sold near the trough. The buyers are sitting on those gains.
What Should Investors Watch Next?
The Federal Reserve’s April 28–29 FOMC meeting is the next event that could move the needle. Any shift back toward rate cuts would likely pull North American inflows with it. Watch $5,000 as the first significant resistance — a sustained move above it would confirm the March low as a cycle floor. The World Gold Council will publish April flow data in early May, which will show whether re-entry has begun.
Gold doesn’t care which pocket it sits in. But who holds it through the next cycle — and at what price — is the only question that actually matters.
Stay On Top of Gold & Silver Prices
Get important market alerts sent straight to your inbox.
SOURCES
1. World Gold Council — ETF Flows: March 2026
2. World Gold Council — China Gold Market Update: A Seasonal Demand Rebound in March (Ray Jia, April 2026)
3. National Bureau of Statistics of China — National Economy Got off to a Good Start in the First Quarter (April 16, 2026)
4. World Gold Council — Gold Price Data
By the GoldSilver Editorial Team — helping investors understand sound money since 2005. This article is for informational purposes only and does not constitute financial, investment, or tax advice. Always consult a qualified financial advisor before making investment decisions.
You May Also Like:
- Silver Market Deficit 2026: Six Years and Getting Worse
- Is the Petrodollar Ending? What the Iran War Means for Gold
- France’s Gold Repatriation Is Done. Germany Is Next
- Gold/Silver Ratio Hits 61.1 — Silver’s Turn to Run
- Silver Holds Near $80 as Iran Ceasefire Revives Rate-Cut Bets
- The Fed Goes Silent in 3 Days – What Does That Mean For Gold?
- Gold Is Down 10% From Its War-Peak — and Still Up 46% in a Year
- Gold Outranks the Dollar at Central Banks — What It Means for Your Savings