Published: 06-26-2026, 03:08 pm
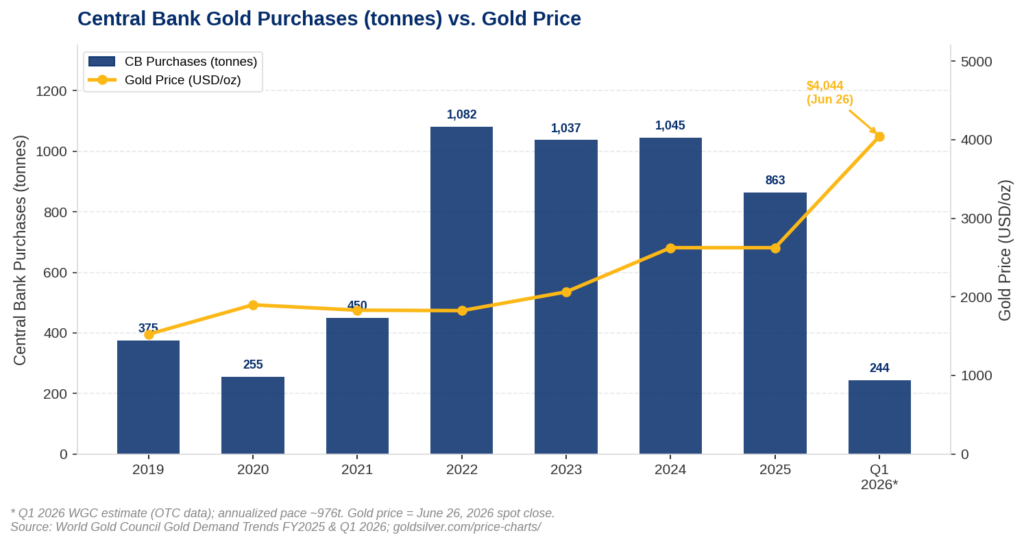
Gold fell roughly 5% this week to $4,044 per ounce — its sharpest weekly loss of 2026. Central bank gold buying in 2026 tells the opposite story. The World Gold Council’s annual Central Bank Gold Reserves Survey, published June 16, 2026 and covering 76 institutions, found that 89% of reserve managers expect global gold holdings to increase over the next 12 months. A record 45% plan to add to their own reserves. That is the most bullish result in the nine-year history of the report.
Two numbers. One week. They point in opposite directions. Understanding why tells you more about gold’s long-term trajectory than any single price chart.
Why the Paper Market Sold Off
The week’s selling was mechanical. May PCE inflation came in at 4.1% year-over-year — the highest since April 2023 — according to the Bureau of Economic Analysis. The release date was Thursday, June 25. Strong Q1 GDP and tight jobless claims added to the pressure, keeping the Federal Reserve’s rate-hike path alive. The CME FedWatch Tool now prices roughly a 63% probability of a September hike and 80% odds of at least one increase before December.
When rate-hike expectations rise, the opportunity cost of holding gold — an asset that pays no yield — increases. Futures traders who bought gold for the rate-cut trade found themselves on the wrong side of that repricing. They sold. The dollar strengthened toward 52-week highs. Gold followed.
This is the mechanism. It is not new. Moreover, it is not a structural shift. Gold’s paper market behaves this way whenever the rate-path narrative changes.
The week’s PCE print also contained an important nuance. Core PCE, which strips out food and energy, came in at 3.4% — the highest since October 2023, but in line with consensus. As a result, September’s rate-hike probability fell from 68% to 63% after the data landed. Gold recovered modestly on Friday, pulling back from Wednesday’s session lows near $3,970.
What the Survey Actually Says
The WGC’s Central Bank Gold Reserves Survey is published once a year. It is, by design, immune to weekly rate moves. Central banks manage their reserve portfolios across decades, not FOMC cycles.
This year’s survey has three findings that matter.
First: The participation rate hit a record. Seventy-six central banks responded — more than ever before in the survey’s nine-year history. That breadth is itself a signal. Gold is no longer a peripheral consideration in reserve management. Every major central bank in the world has an active opinion about it.
Second: Conviction is accelerating, not fading. According to the WGC survey, a record 45% of respondents plan to increase their own gold reserves over the next 12 months. That is up from 43% in 2025. The trend has run consistently in one direction. No survey year has seen this percentage fall. Meanwhile, just 1% expect their reserves to decline.
Third: The dollar is losing ground in sovereign portfolios — deliberately. According to the WGC survey, 74% of respondents expect the US dollar’s share of global reserves to fall moderately or significantly over the next five years. Gold’s share is expected to rise. This is not a forecast about exchange rates. It is a statement about reserve policy — the considered strategic decisions of institutions that manage national wealth.

The Edge Every Investor Needs Smarter precious metals investing starts here. The Nuggets Newsletter brings you essential market insights, Fed updates, global trends, educational videos, and much more.
Gold Now Outranks US Treasuries as the World’s Largest Reserve Asset
The survey lands at a historically significant moment. Gold has already surpassed US Treasuries as the world’s largest reserve asset for the first time since 1996. That finding comes from the European Central Bank’s June 2, 2026 report on international reserves. Foreign central banks now hold roughly $4.5 trillion worth of gold. By comparison, their US government bond holdings stand at approximately $3.5 trillion.
That crossover happened through two mechanisms: rising gold prices increased the mark-to-market value of existing holdings, and sovereign institutions kept buying. The People’s Bank of China has added to its gold reserves for 20 consecutive months. According to the World Gold Council’s Gold Demand Trends report, central bank purchases are projected at roughly 850 tonnes in 2026. That is in line with 2025’s 863 tonnes and well above the 473-tonne annual average recorded between 2010 and 2021.
Two Markets, One Metal
Two types of buyers are active in the gold market right now. They operate on completely different time horizons, and understanding that difference resolves the apparent contradiction between a falling price and a record bullish survey.
The paper gold market — futures, ETFs, options — is dominated by institutional traders, hedge funds, and systematic strategies. These participants respond to the Fed’s rate path, the dollar’s direction, and the opportunity cost of holding a non-yielding asset. When the rate path shifts hawkish, they sell. They do so quickly, with leverage, and in large volumes. That selling moves the spot price in the short term.
The central bank gold market operates on a completely different mandate. Sovereign reserve managers are not trading gold. Instead, they are allocating to it as part of a long-term reserve strategy. Their diversification mandate does not change when May PCE comes in at 4.1%.
Furthermore, the data supports this. According to the World Gold Council’s Gold Demand Trends Q1 2026 report, central bank net purchases reached approximately 244 tonnes in Q1 2026. The WGC estimated this via London OTC market data, and the figure exceeds both Q4 2025 and the five-year average. Those purchases occurred at prices that were, at the time, near record highs. Sovereign buyers are not waiting for gold to pull back. They are buying because they have structural reasons to own it that are indifferent to weekly price moves.
So while rate-cycle traders sold gold for the second straight week, central banks across 76 institutions confirmed they plan to buy more.
What It Means for the Long-Term Holder
If you own physical gold — bars, coins, stored metal — this week’s price move did not change what you hold. The ounces in your possession carry no counterparty risk. They cannot be margin-called. Their value is not tied to the rate-path expectations of futures traders. They are the same ounces they were last Friday, and the Friday before that.
What changed this week is where the paper price sits. At roughly 28% below its January 28 all-time high of $5,589, that price is where central banks — collectively managing trillions in national wealth — have confirmed they see value.
The survey does not tell you where gold will be in three months. Neither does today’s price. However, both tell you which buyers operate on a 5-year horizon and which ones operate on a 5-day horizon. The 76 institutions in the WGC survey are not looking at Friday’s PCE print. Instead, they are looking at the $39.3 trillion US national debt, per US Treasury Fiscal Data. They are also watching the declining dollar share of global reserves and gold’s track record as a store of value through every monetary cycle of the past century.
The paper market moves the price. The central bank market sets the floor.
Stay On Top of Gold & Silver Prices
Get important market alerts sent straight to your inbox.
SOURCES
1. World Gold Council — Central Bank Gold Reserves Survey 2026; Central Banks Set to Step Up Gold Buying Over Next Year; Gold Demand Trends Full Year 2025; Central Banks, Gold Demand Trends Q1 2026
2. Bureau of Economic Analysis — Personal Income and Outlays, May 2026
3. CME Group — FedWatch Tool
4. Federal Reserve — FOMC Statement and Summary of Economic Projections, June 17, 2026
5. GoldSilver — Live Gold & Silver Spot Prices
6. US Treasury Fiscal Data — Debt to the Penny
Disclaimer: This article is for informational purposes only and does not constitute financial or investment advice. Always consult a qualified financial adviser before making investment decisions.
You May Also like:
- Silver Looks Like It’s Losing. The Ratio Says It’s Loading.
- Q1 GDP Beat. Jobless Claims Beat. Gold Rose. Here’s Why.
- PCE Hit 4.1%. Gold Went Up. Here’s Why.
- 298 Tonnes of ETF Gold Is Underwater. Central Banks Aren’t.
- Hawkish Fed, Gold Below $4,000, Silver Below $60 — and a Market That Disagrees.
- Gold Just Broke $4,000. The Mainstream Called the Debasement Trade Dead. They’re Wrong.
- Two Things Are Hitting Gold Simultaneously. Only One Is About Gold.