Published: 05-14-2026, 12:00 pm | Updated: 06-19-2026, 03:29 pm
Key Takeaways
- Silver surged 6% on May 11 after a US-China tariff truce, then pulled back on hotter-than-expected April CPI data — the metal is caught between a reopening industrial demand story and a Fed that is increasingly unlikely to cut before September.
- The gold/silver ratio compressed from ~62:1 to ~55:1 in a single week in May 2026, one of the fastest moves in years — and it tells you something important about where silver stands right now.
- The structural case is unchanged: six consecutive years of supply deficit, nearly 762 million ounces of cumulative drawdowns, and a physical market that is structurally tighter than most investors realise.
Last verified: June 20, 2026 — Live silver price at GoldSilver.com
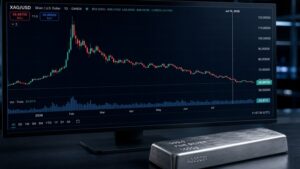
Silver hit an all-time high of $121.64 on January 29, 2026. It spent February and March giving most of that back, then consolidated between $70 and $80 through April. On May 11, it surged 6% in a single session after the US and China announced a 90-day tariff reduction — briefly clearing $87 by May 13 before April CPI data came in at 3.8%, above forecasts, and dragged it back to $84. If you are looking for a silver price forecast May 2026 you can actually use, that one week tells you everything about the environment you are navigating.
Silver is simultaneously a monetary metal, an industrial commodity, and a speculative vehicle. When fear is high, it trades like gold. When manufacturing is humming, it trades like copper. In a dovish rate environment, it moves like a leveraged version of gold — 2–3 times the percentage of any gold move. In May 2026, all three forces are pulling in different directions at the same time — which is exactly why any silver price forecast May 2026 built on a single thesis is going to disappoint.
These four numbers give you that understanding.
What Is the Gold/Silver Ratio Telling Us Right Now?
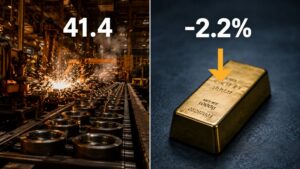
The gold/silver ratio sat at approximately 62:1 entering May 2026. Then the US-China tariff truce hit on May 10–11, and it compressed to below 55 in a single week — one of the fastest moves in years. As of May 14, it sits at 55.25. Gold barely moved during that same period. Silver did all the work, which confirms exactly what the tariff news was pricing: not a safe-haven story, but an industrial demand repricing.
That is the ratio’s signal in May 2026. At the 2011 silver bull market peak, the ratio compressed to 31:1. During the COVID crash of 2020, it spiked to 125:1 — the most extreme silver undervaluation in modern market history [Silver Institute]. The long-run average depends on which era you study: roughly 47:1 across the 20th century, but closer to 60–65:1 since 2000. At 55:1, silver is below that modern average — cheap relative to gold, though it has already repriced significantly from the 80:1 levels seen in late 2025.
The direction of the ratio from here depends heavily on two near-term events: the outcome of the Trump-Xi Beijing summit and the June 16–17 FOMC meeting. A credible trade extension compresses the ratio further. A breakdown reverses it. When it trends lower over weeks and months, silver is in outperformance mode. When it trends higher, however, tailwinds are fading. A sustained move below 50:1 would signal silver entering clear leadership mode, consistent with bull-market history. A reversal back above 62:1 would indicate the tariff trade is unwinding.
As of June 2026, that reversal has happened — the ratio has expanded back to 64:1 following the Fed’s hawkish dot plot. See the June 2026 silver price outlook for what changed.

Your Gold Buying Guide Most investors overpay when they buy gold. Then overpay again when they sell. This guide shows you exactly what to own — and why.
Silver Price Forecast May 2026: What Are Analysts Actually Predicting?
The institutional consensus has shifted meaningfully since January. Bank of America made headlines in April with a $135–$309 year-end target range — built on ratio compression scenarios, not a base case — while UBS moved in the opposite direction, revising its year-end target down from $85 to $80, citing demand destruction at elevated prices. The spread between the lowest and highest forecasts is the widest seen for any major commodity in recent memory. That spread is itself information: the market genuinely does not know.
J.P. Morgan sees silver averaging approximately $81/oz for full-year 2026 — more than double its 2025 average [J.P. Morgan Global Research]. Goldman Sachs projects a 2026 average in the $85–100 range, treating silver as a primary strategic metal of the green energy transition. Citigroup’s second-half 2026 target stands at $110, citing acute physical supply shortages. ING sits more conservatively, averaging $78 for the full year. The Reuters 30-analyst median sits near $79.50 [Reuters].
Silver at $84 today is already at or above both the J.P. Morgan full-year average and the Reuters median — which means those targets either get revised upward or the year’s average path implies softness from here before a recovery. In any silver price forecast for May 2026, the signal worth tracking is not any single number — it is the direction of revisions mid-year. Upgrades from J.P. Morgan or Goldman are bullish. Downgrades are a genuine headwind.
Why Does Silver’s Structural Supply Deficit Matter?
Underneath the week-to-week volatility, the structural story that defines any serious silver price forecast May 2026 has not changed. The silver market is heading into its sixth consecutive year of supply deficit, with the shortfall projected at approximately 46 million ounces. This is the number that makes silver’s long-term case genuinely different from gold. Above-ground gold stocks dwarf annual mine supply — gold is essentially never consumed. Silver is. Solar panels, electric vehicles, semiconductors, and medical devices use silver permanently. It does not come back.
Cumulative draws from above-ground stocks since 2021 have reached nearly 762 million ounces — roughly nine months of global mine output [Silver Institute, World Silver Survey 2026]. The physical tightness is visible in the data: COMEX registered inventories have fallen from their October 2025 peak of 531 million ounces to roughly 315 million ounces, and 95 million ounces flowed out of the United States in just the first two months of 2026. Additionally, annual mine production held at around 813 million ounces in 2025, edging toward 820 million in 2026. Approximately 70% of silver is mined as a byproduct of gold, copper, and zinc — so supply cannot simply respond to price signals. When silver rallied 147% in 2025, new mines did not appear overnight. The lead time from discovery to production averages more than eight years.
The legitimate counterpoint is solar thrifting. In 2026, photovoltaic manufacturers are actively reducing silver per panel, with PV demand projected to decline around 19% year-on-year [PV Magazine / Metals Focus, World Silver Survey 2026]. Jewellery consumption is down 9% and silverware demand is down 17%. These are real headwinds. But silver’s electrical conductivity has no cost-effective substitute at scale, and as EV production, AI data centres, and 5G infrastructure expand through the late 2020s, new demand vectors are coming online faster than thrifting can close the gap.
How Do Real Yields Drive the Silver Price?
Real yield direction is the most important short-to-medium-term driver of silver’s price — and in May 2026, the silver price forecast May 2026 picture just got more complicated. Before May 13, CME FedWatch was pricing roughly a 48% probability of a June cut. Then April CPI came in at 3.8% — above the 3.7% forecast and the highest reading since May 2023 — and within hours the probability of a June cut collapsed to under 8%. Markets have now pushed their first-cut expectations to September at the earliest, with most weight falling on November or December.
The Federal Reserve cut rates through 2025, bringing the federal funds rate to a target range of 3.50–3.75%, where it has held at three consecutive meetings [Federal Reserve]. The next decision is June 16–17, and it includes a dot plot — the first since March, and potentially the first under incoming Fed Chair Kevin Warsh, whose hawkish inflation stance is well documented. The pattern when the Fed eventually does ease is consistent: the 2019–2020 easing cycle sent silver from $14 to $29. The 2025 easing cycle — which carried into silver’s January 2026 peak — sent it from around $29 to $121. Each time real yields compressed, silver amplified gold’s move by 2–3x. Silver also consolidated every time the Fed paused — and after the April CPI print, that pause just got longer.
This is not a breakdown. It is a pause. The June 16–17 FOMC meeting and its dot plot is the next scheduled moment where that changes — or doesn’t. A hawkish dot plot reinforcing the current hold would extend silver’s consolidation into Q3. A shift signalling September easing would give silver’s next leg significant runway.
The dot plot has since been released. For the outcome and what it means for silver, read the June 2026 silver price outlook.
Stay On Top of Gold & Silver Prices
Get important market alerts sent straight to your inbox.
People Also Ask
What is the gold/silver ratio telling investors in May 2026?
The gold/silver ratio is one of the most telling signals in any silver price forecast May 2026. It compressed from approximately 62:1 to 55:1 in a single week after the US-China tariff truce — a move driven entirely by silver, while gold barely moved. That split confirms silver is trading as an industrial metal right now, not a safe-haven. At 55:1, it sits below the modern post-2000 average of roughly 60–65:1, meaning silver remains historically cheap relative to gold. Whether that continues depends heavily on whether the 90-day tariff truce holds.
Why is silver’s price so volatile in May 2026?
Silver volatility in May 2026 reflects a genuine silver price forecast May 2026 dilemma: the metal is caught between three competing forces. a positive industrial demand catalyst from the US-China tariff truce, a negative monetary catalyst from hotter-than-expected April CPI data pushing Fed cut expectations back to September at the earliest, and an unresolved Middle East conflict keeping oil and inflation risks elevated. The result is sharp moves in both directions — 6% up on May 11, then back to $84 on May 13. This is silver doing exactly what it does when macro signals are genuinely mixed.
What is the silver supply deficit and why does it matter?
The silver supply deficit is a core reason why most serious silver price forecast May 2026 analysis remains structurally bullish despite the near-term noise. The Silver Institute’s World Silver Survey 2026 projects a sixth consecutive annual deficit of approximately 46 million ounces, with cumulative draws since 2021 reaching nearly 762 million ounces. COMEX registered inventories have fallen to roughly 315 million ounces from 531 million ounces in October 2025. Because roughly 70% of silver is mined as a byproduct of other metals, supply cannot ramp up in response to higher prices — making the deficit structurally persistent.
What are analysts forecasting for the silver price in May 2026?
The silver price forecast May 2026 picture spans an unusually wide range. J.P. Morgan’s full-year average sits at approximately $81/oz, the Reuters 30-analyst median at $79.50, and ING at $78 — all below where silver is trading today. On the high end, Citigroup targets $110 for H2 and Bank of America issued a $135–$309 scenario range in April based on ratio compression. UBS cut its year-end target to $80, citing demand destruction. With silver at $84, it has already cleared most consensus forecasts — meaning either those targets get revised higher, or the price path implies softness from here before the next leg.
How does the June 2026 Fed meeting affect silver?
The June 16–17 FOMC meeting is the single most important near-term date in any silver price forecast May 2026 investors are watching. It includes a dot plot — the Fed’s first updated projection since March — and the probability of a cut at that meeting has collapsed from 48% to under 8% following the hot April CPI print. A hawkish dot plot would extend silver’s consolidation through Q3. Any signal of September easing would be a significant tailwind. For silver, the Fed calendar is the roadmap.
The Pause Is Not the Story
The bear case in May 2026 is specific and immediate: a breakdown in US-China trade talks after the 90-day truce, a dot plot on June 17 that signals no cuts this year, and inflation that stays sticky through Q3. Any of those outcomes extends the consolidation. The right position is a deliberate, sized allocation — not a maximum bet on the next leg.
But the structural thesis has not changed. Six years of deficits. Irreplaceable industrial demand. Dollar debasement. A monetary system diversifying away from paper assets. The tariff truce of May 2026 is a near-term catalyst. The deficit is a multi-year floor. Any credible silver price forecast May 2026 has to hold both of those ideas at once. What changed this week is the near-term sentiment. What has not changed is the reason to own silver in the first place.
If you’re ready to act on the framework — not just follow it — you can start building your position at GoldSilver.
SOURCES
1. nFusion Solutions — Live Gold and Silver Spot Prices, May 14, 2026
2. Silver Institute / Metals Focus — World Silver Survey 2026, April 15, 2026
3. PV Magazine / Metals Focus — Silver Demand From PV Industry Expected to Drop 19% This Year, April 2026
4. J.P. Morgan Global Research — How Will Silver Prices Fare in 2026?
5. Goldman Sachs — 2026 Silver Price Outlook, per multiple analyst summaries.
6. Citigroup Global Markets — Silver Price Target, H2 2026, per analyst reports.
7. Bank of America Global Research — Silver Commodity Outlook, 2026, per analyst reports.
8. Reuters — 30-Analyst Silver Price Median Survey, 2026
9. Federal Reserve — FOMC Press Release, April 29, 2026
10. CME Group — FedWatch Rate Probability Tool
Disclaimer: This article is for informational and educational purposes only. It does not constitute investment advice. Please consult a qualified financial adviser before making any investment decisions.
You may also like:
- Dollar Dominance Is Fading. Gold and Silver Are Paying Attention.
- GoldSilver: Home Storage and Vault in One Account
- The Bond King’s Golden Signal: Jeffrey Gundlach on Gold
- Gold Price Outlook May 2026: Why Institutional Forecasters Still See $5,000
- India’s ‘Patriotic’ Gold Buying Freeze: What It Means for Prices
- How to Time Your Gold & Silver Buys Using Technical Analysis
- Silver Jewelry or Bullion? A Buyer’s Guide to the Real Difference
- Gold and Oil Move Opposite Ways. Here’s Why That Matters