 Silver Rises Over 120% YTD




Why Is Gold So Expensive? The 5 Mechanisms Behind the Price
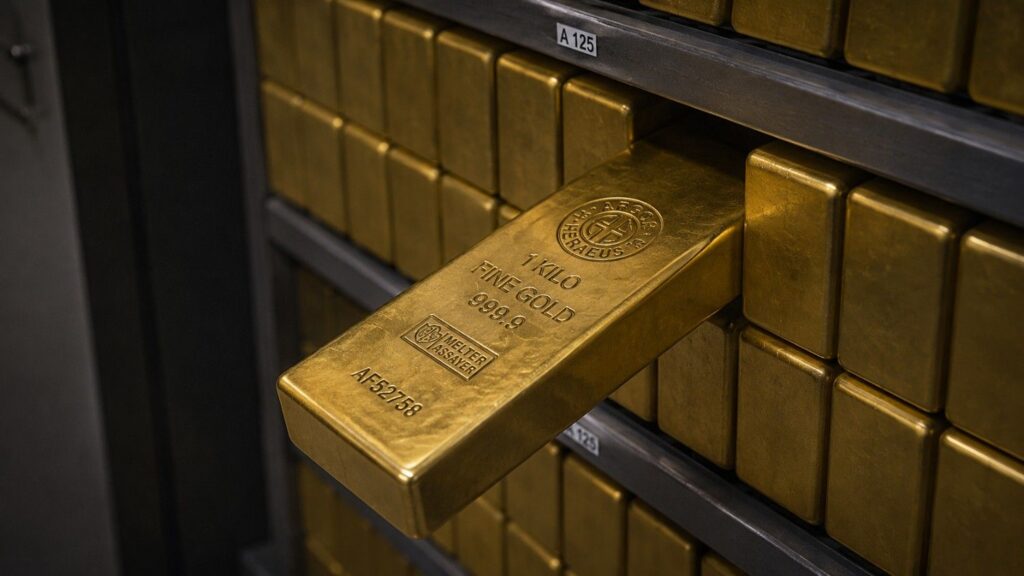
Gold costs roughly $4,000 per ounce today. Here are the five specific, measurable forces that explain exactly why — and why every major bank expects the price to go higher.
Gold’s Worst Week of 2026. Central Banks Just Filed a Record Buy Signal.
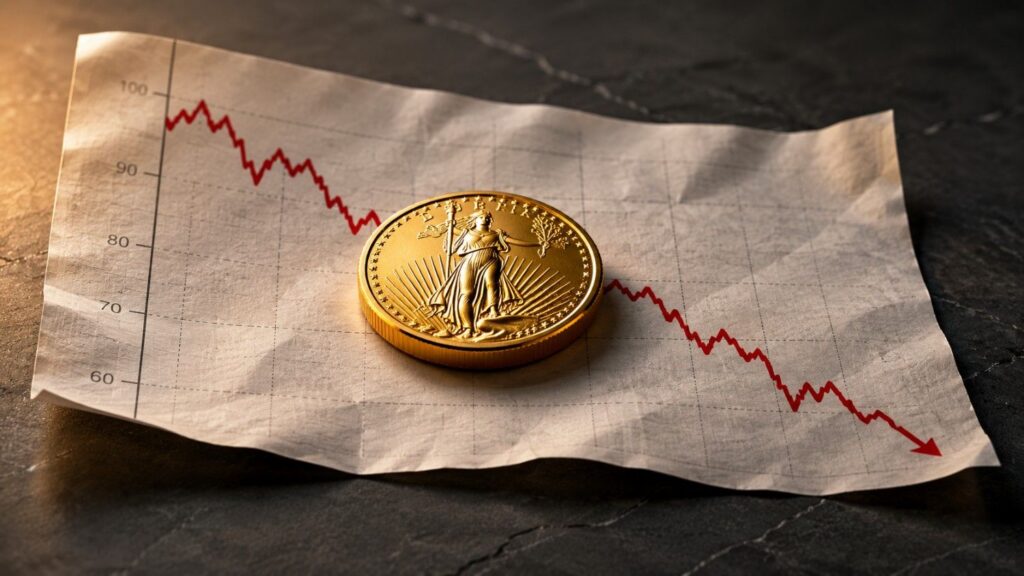
Gold is down 5% this week. The World Gold Council’s 2026 survey of 76 central banks found 89% expect global gold reserves to increase — a record. Two markets, one metal, completely different time horizons.
298 Tonnes of ETF Gold Is Underwater. Central Banks Aren’t.
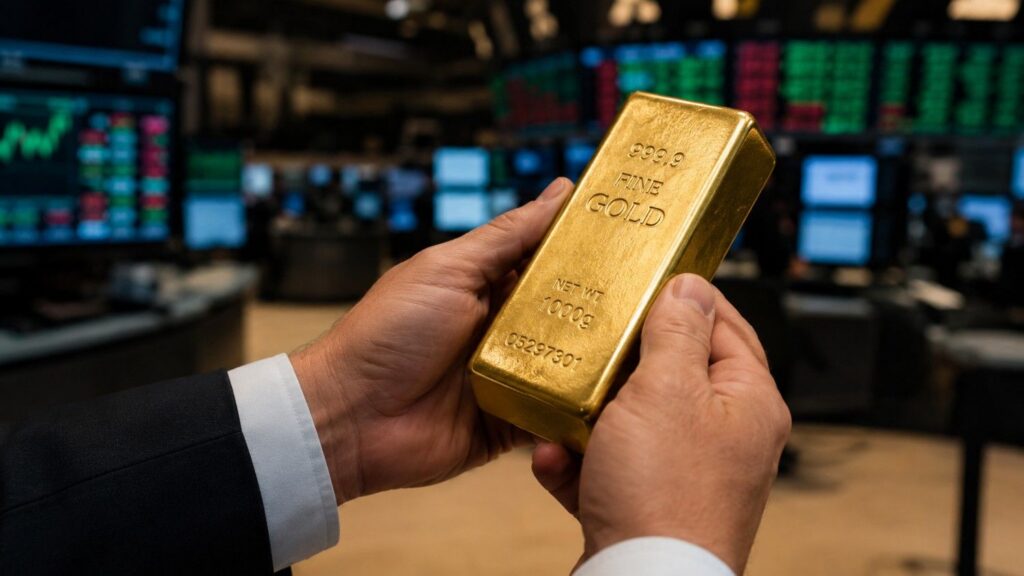
Approximately 298 tonnes of gold inside ETFs is currently held at a loss at current price levels — a structural ceiling on any near-term recovery. At the same time, the WGC’s 2026 survey found a record 45% of central banks plan to add to their reserves. Two markets. One metal. Very different time horizons.
How Central Banks Decide How Much Gold to Hold
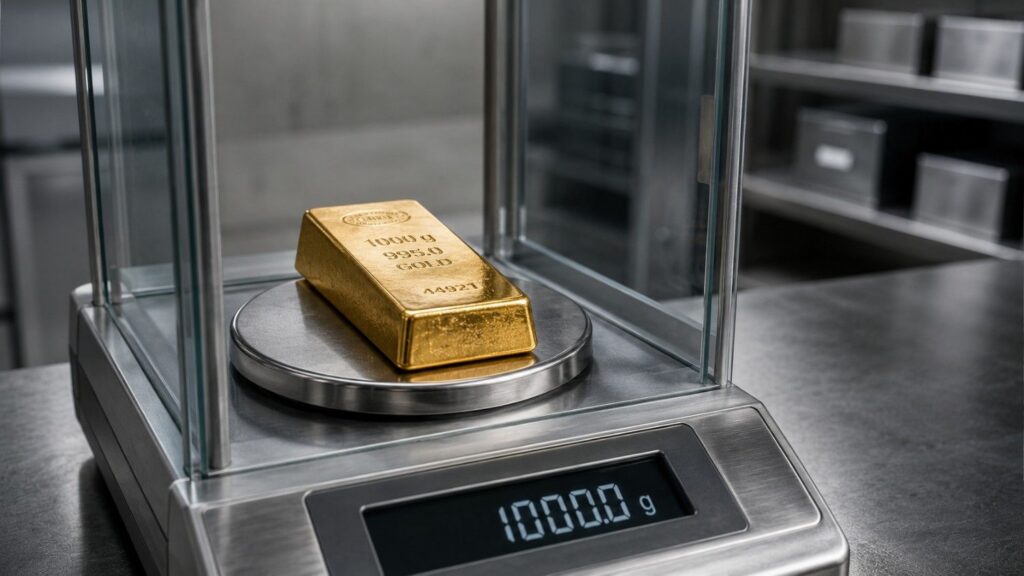
The World Gold Council’s 2026 survey asked 76 central banks how they decide how much gold to hold. The answer comes down to three objectives: safety, liquidity, and return — in that order. Here’s what that framework looks like in practice, why a record 45% of central banks plan to increase their allocation this year, and why the same logic applies to individual investors.
Wall Street’s $6,000 gold call rests on data most investors never see
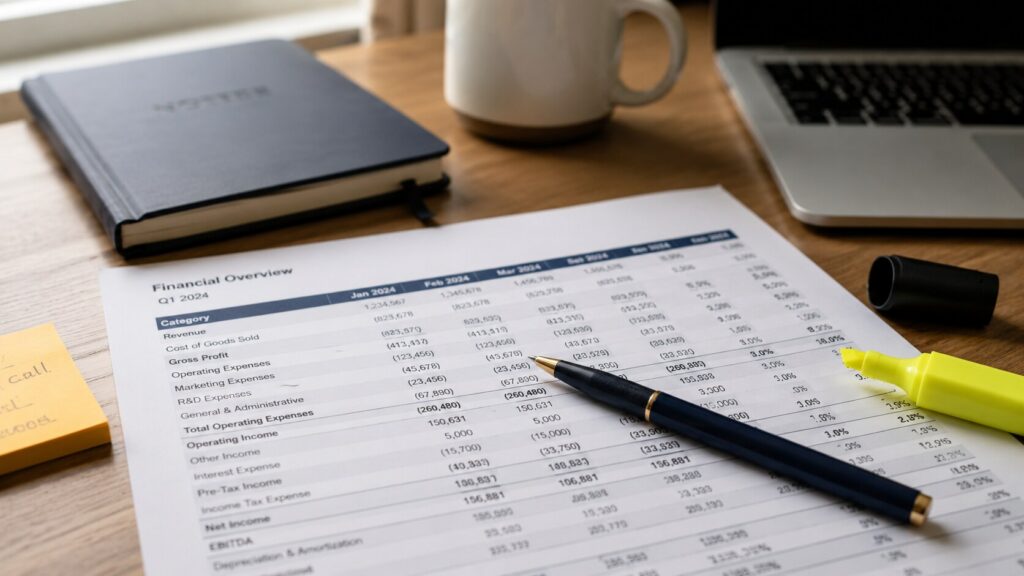
Wall Street’s $6,000 gold forecast isn’t built on the price target — it’s built on a central bank buying figure most investors never see. Official IMF data shows 16 tons of net purchases in Q1 2026. The World Gold Council estimates the real figure at 244 tons. That gap is the story.
Gold Price News: Goldman, China, CPI, and the Fed Explained
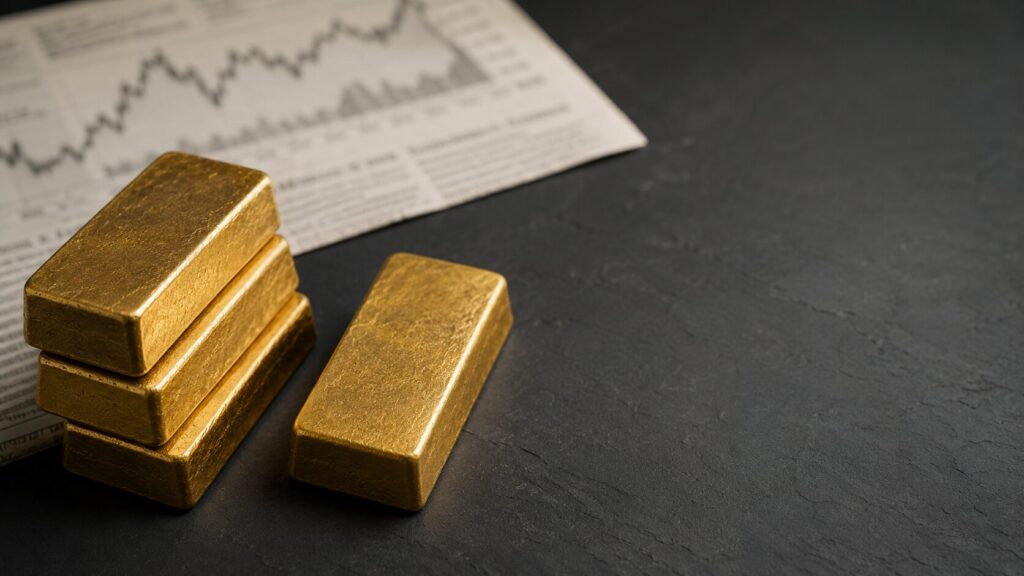
Goldman Sachs just pushed every 2026 rate cut to 2027. China’s central bank bought gold for the 19th month in a row. CPI drops Wednesday. A fragile ceasefire is holding — barely. And silver just had its worst week relative to gold in months. Here is what each story means for precious metals investors.
Does Physical Gold Have Counterparty Risk? The Facts
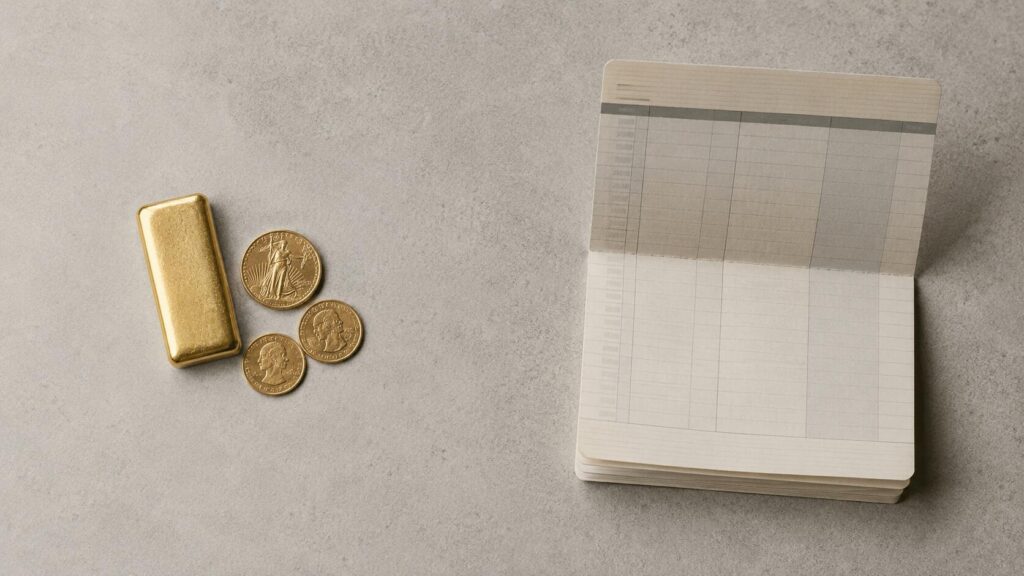
When you deposit money at a bank, you are not storing it. You are lending it. Physical gold counterparty risk is zero because allocated metal is not a claim on any institution — it cannot be frozen, diluted, or devalued by policy. This explainer covers the mechanism and how to structure both approaches correctly.
Gold Is Down 22% — The Same Drop as 2022. The Floor Is Not the Same.
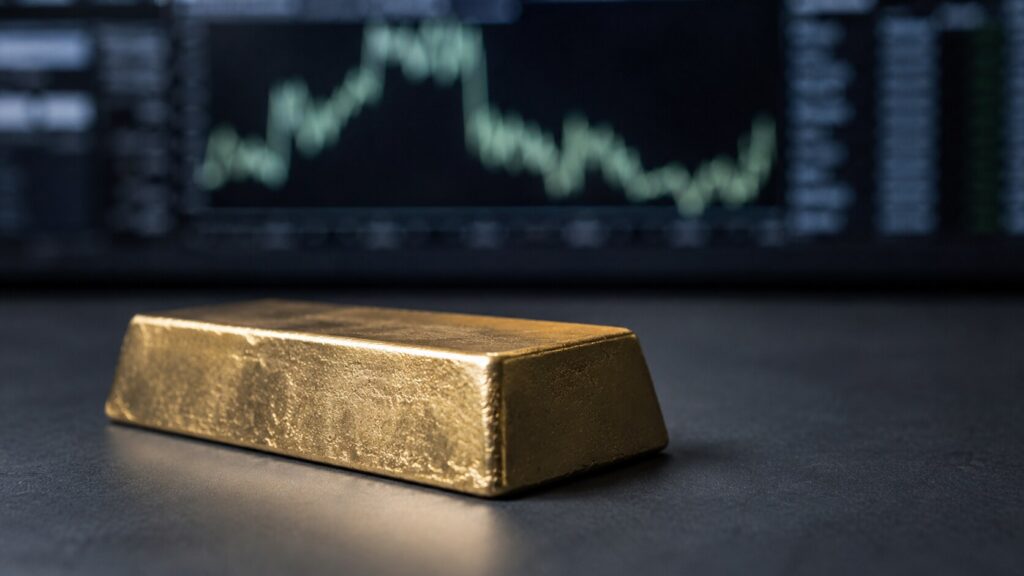
Gold has fallen 22% from its January 2026 all-time high of $5,589 — the same magnitude as the entire 2022 Fed hiking cycle. But in 2022, the Fed delivered 525 actual basis points of rate increases. Today, markets are pricing roughly a 43–50% probability of a single speculative hike that hasn’t happened yet. Same number. Very different floor. Here’s what the gap between those two corrections is telling long-term holders of physical gold.
Why Is Gold Still a Safe Haven? Switzerland’s Biggest Refiner Just Answered.
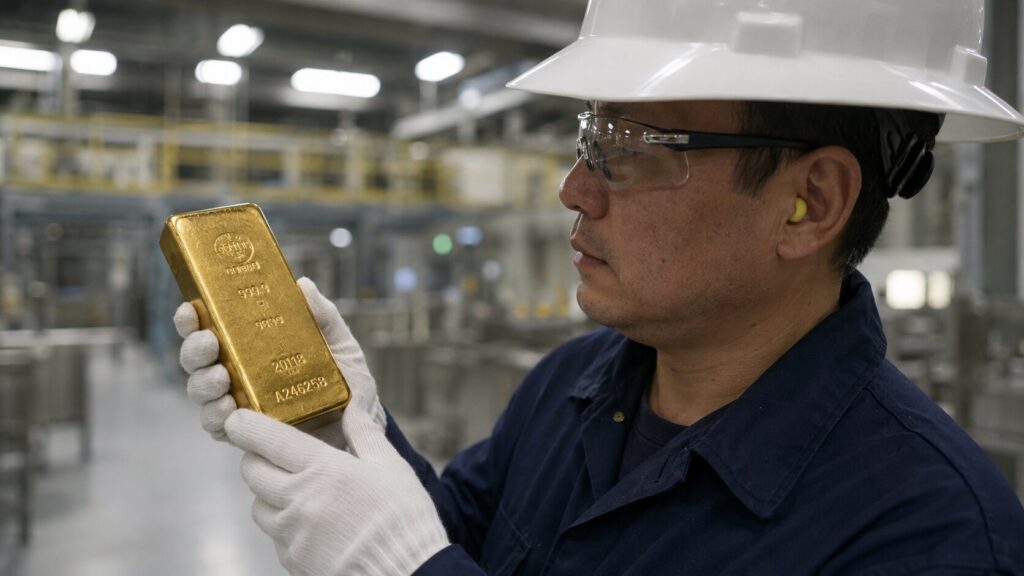
Valcambi’s incoming CEO processed 1,000 tonnes of gold last year for national banks and bullion traders. Here’s the institutional case for why gold remains a strategic safe haven in 2026 — and what central bank behavior reveals about where the global monetary system is heading.
Gold Rate Hike Fears Are Weighing on Prices. Here’s the Full Picture.

Gold slipped to $4,448 this week as rate-hike fears and Middle East tensions drove a 2% weekly loss. Central banks bought 244 tonnes in Q1 2026 — yet retail demand has cooled sharply. With May jobs data due today and gold holding just above its 200-day moving average, here is what five key developments mean for anyone holding precious metals right now.


