Published: 05-05-2026, 05:24 pm | Updated: 05-05-2026, 05:29 pm
Gold and silver market update — May 5, 2026
Key Takeaways
- The IMF officially abandoned its baseline economic forecast on May 4, 2026. It declared its “adverse scenario” — 2.5% global growth and 5.4% headline inflation — is now the operating reality, not a downside risk.
- IMF Managing Director Kristalina Georgieva warned that if the conflict extends into 2027 with oil near $125 per barrel, inflation expectations risk “de-anchoring.” That regime shift historically compresses real yields and strengthens gold’s structural case.
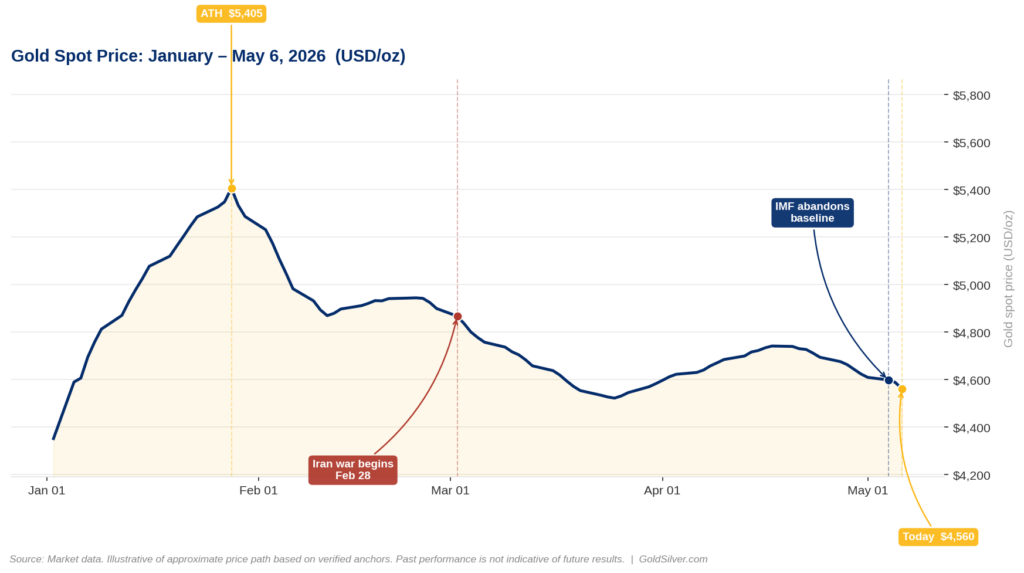
- For investors holding physical gold, the $4,560 price as of May 5, 2026 reflects a temporary mechanism. Oil-driven inflation is locking the Fed out of cutting — and the IMF just confirmed that pressure is deepening, not resolving.
The International Monetary Fund spent weeks building an economic forecast for 2026. On Monday, its managing director stood at a podium in Beverly Hills and declared it obsolete.
IMF chief Kristalina Georgieva spoke at the Milken Institute Global Conference on May 4, 2026. She said the Fund’s baseline scenario — built on the assumption of a short-lived Middle East conflict — is “further and further behind in the rear-view mirror.” The world has already entered the IMF’s “adverse scenario”: slower growth and higher inflation. Gold is trading at $4,560.35 as of May 5, 2026. Understanding why that price and that warning belong in the same sentence is what this article is about.
Why Did the IMF Abandon Its Own Economic Forecast?
On May 4, 2026, IMF Managing Director Kristalina Georgieva spoke at the Milken Institute Global Conference in Beverly Hills. She declared that the Fund’s “reference scenario” is “no longer possible.” That scenario had assumed a short-lived Middle East conflict. It projected global growth of 3.1% and inflation of 4.4% in 2026. Instead, the IMF’s “adverse scenario” is now in effect. Under that scenario, global growth slows to 2.5% in 2026 and headline inflation rises to 5.4%.
Georgieva cited three conditions that have already activated the downside case: the ongoing war, oil prices at or above $100 per barrel, and rising inflationary pressures. For gold investors, this matters. It represents the world’s foremost monetary institution formally closing the door on the benign inflation path that had been keeping real yields elevated and gold suppressed.
The IMF had published three scenarios in April, all built around the Middle East conflict. The “reference scenario” — the baseline — assumed a short-lived war. It projected global growth of 3.1% in 2026 and inflation of 4.4%. That was the official working assumption for every finance ministry, central bank, and treasury desk on the planet.
Georgieva walked up to a microphone on Monday and called it obsolete. “This scenario, with every day that passes, is further and further behind in the rear-view mirror,” she said.
She then went one step further. If the conflict extends into 2027 and oil reaches $125 per barrel, she warned: “We have to expect a much worse outcome. Then we are going to see inflation climbing up, and then inevitably, inflation expectations would start de-anchoring.”
That phrase — de-anchoring inflation expectations — is the most consequential thing she said.

The Edge Every Investor Needs Smarter precious metals investing starts here. The Nuggets Newsletter brings you essential market insights, Fed updates, global trends, educational videos, and much more.
What Does “De-Anchoring Inflation Expectations” Mean for Gold?
As of May 2026, inflation expectations are still anchored. Central banks have not yet lost the market’s trust. However, Georgieva’s warning describes the specific path by which that trust breaks down — and why it creates a structurally different environment for gold.
Anchored inflation expectations mean people and businesses believe prices will return to normal. As a result, they don’t bake permanent price increases into wages and contracts. When expectations de-anchor, the mechanism reverses. Workers demand higher wages because they expect higher prices. Companies then raise prices because labor costs are rising. The feedback loop becomes self-reinforcing. That is not a 6-month problem. It is a 5–10 year regime change.
The clearest historical parallel comes from the late 1960s into the 1970s. The U.S. Federal Reserve allowed inflation expectations to de-anchor through a combination of fiscal pressure and delayed tightening. Consequently, gold — freed from the Bretton Woods peg in August 1971 — rose from $35 per ounce to $850 per ounce by January 1980. That is a 24x gain over roughly nine years. The Fed eventually broke that cycle with the Volcker shock: 20% interest rates that triggered a severe recession. The lesson is clear. Once inflation expectations de-anchor, the cure is worse than the disease. Furthermore, central banks trapped by government debt today simply don’t have the Volcker option.
So what makes this moment specific to gold? The IMF isn’t just warning about inflation. It is warning about the specific condition — de-anchored expectations — that historically forces central banks to choose between two bad options. They can raise rates sharply and risk a debt-driven recession. Or they can let inflation run and accept that savings are being silently destroyed. The Fed, constrained by approximately $1 trillion in annual interest payments on US debt (Congressional Budget Office projection, fiscal year 2026), has limited room on the first option. Gold exists precisely in the gap between those two bad choices.
Georgieva also added a detail that didn’t get wide coverage. Fertilizer prices are already 30–40% more expensive because of supply chain disruption from the Strait of Hormuz closure. According to her Milken Institute remarks, that will drive food prices up 3–6%. In other words, inflation is broadening from energy into everyday essentials.
What Are Central Banks and Major Institutions Doing About It?
The clearest institutional signal is what central banks are doing with their own reserves. According to the World Gold Council’s Gold Demand Trends Q1 2026 report, published April 29, 2026, central banks purchased a net 244 tonnes of gold in the first quarter of 2026. That figure continues a multi-year trend of uninterrupted net purchases — extending through some of the highest gold prices in history. These institutions are not buying as a trade. Instead, they are repositioning reserves against the exact environment Georgieva described: one where inflation expectations risk de-anchoring, sovereign debt constrains monetary policy, and fiat currency purchasing power faces structural pressure.
Chevron Chairman and CEO Mike Wirth spoke on the same Milken Institute panel as Georgieva on May 4, 2026. He confirmed the physical supply dimension. Specifically, he said oil shortages will “begin appearing around the world” because of the Hormuz closure, with economic contraction set to begin first in Asia as demand adjusts to constrained supply. This is not a financial forecast. It is an operational assessment from the head of one of the world’s largest energy companies.
It is also worth addressing the counterargument honestly. If the Middle East conflict resolves and oil drops sharply, inflation pressure eases, real yields recover, and gold faces genuine headwinds. A ceasefire that durably reopens Hormuz is the clearest path to a gold pullback. That is a real risk. However, Georgieva’s statement directly addresses this scenario. The IMF’s original “reference case” assumed exactly that resolution — and she publicly declared it no longer viable as of May 4, 2026.
What Does the IMF Forecast Shift Mean for Physical Gold Holders?
The IMF is not a gold advocate. It is the institution that manages the global fiat currency system. When the IMF’s managing director publicly abandons her own institution’s baseline forecast and warns about inflation expectations de-anchoring, she is not making a case for gold. She is instead describing, with clinical precision, the exact monetary environment where gold has historically outperformed every paper alternative.
The mechanism is straightforward. De-anchored inflation expectations mean real yields — the return on savings after inflation — get structurally compressed. The Fed cannot raise rates aggressively because the US government pays approximately $1 trillion a year in debt interest at current levels (Congressional Budget Office, fiscal year 2026 projection). Raising rates further risks a debt-service spiral. So real rates stay suppressed. And suppressed real rates are gold’s most reliable structural tailwind.
For investors holding physical gold, the $4,560 price as of May 5, 2026 is not reflecting a weakened structural thesis. Rather, it reflects a temporary mechanism — oil-driven inflation locking the Fed out of cutting — that the IMF just confirmed is deepening, not resolving.
That’s not doomsday thinking. In fact, that’s the IMF’s official working assumption.
What to Watch: Key Dates for Gold Investors in May 2026
Three key dates matter from here.
Friday, May 8: Nonfarm Payrolls. The Dow Jones economist consensus has collapsed to approximately 53,000 jobs. A weak print reopens the rate-cut debate and compresses real yields directly.
Tuesday, May 12: April CPI (Bureau of Labor Statistics, 8:30 a.m. ET). This is the first inflation print after the IMF formally adopted its adverse scenario. A hot number validates Georgieva’s framing in real time.
Friday, May 15: Powell’s term as Fed Chair expires. The full Senate vote on Kevin Warsh’s nomination is expected the week of May 11. If confirmed, Warsh’s stated preference for the Federal Reserve Bank of Dallas’s trimmed mean PCE measure — currently running at approximately 2.3% versus core PCE at 3.0% — could signal an earlier pivot to rate cuts than markets currently price.
Watch $4,500 as near-term technical support. A hold above it — with Warsh’s potential arrival, the CPI print, and Friday’s jobs data all ahead — sets up a potential retest of $4,700.
Stay On Top of Gold & Silver Prices
Get important market alerts sent straight to your inbox.
SOURCES
1. Reuters via Jerusalem Post — IMF chief Georgieva warns of ‘much worse outcome’ if Middle East war drags into 2027
2. International Monetary Fund — World Economic Outlook, April 2026: Global Economy in the Shadow of War
3. World Gold Council — Gold Demand Trends Q1 2026
4. World Gold Council — Central Banks: Gold Demand Trends Q1 2026
5. Congressional Budget Office — Budget and Economic Outlook: 2026 to 2036
6. Bureau of Labor Statistics — Consumer Price Index: Release Schedule
7. CNBC — Trump Fed pick Kevin Warsh clears key Senate hurdle, teeing up final vote
8. CNBC — Kevin Warsh gave his preferred way for measuring inflation
Disclaimer: This article is for informational purposes only and does not constitute financial or investment advice. Always consult a qualified financial adviser before making investment decisions.
You May Also Like:
- What’s Really Driving Gold Prices Today — 5 Key Signals
- Gold Price and the Jobs Report: A Pre-Market Guide
- The Gold-Silver Ratio Is Expanding — and Being Misread
- Gold, Silver, and Stagflation: 5 Signals That Matter Now
- Why Gold Fell on the Hormuz Tanker Strike
- WGC Q1 2026: What Asia Knows That Wall Street Doesn’t
- BEA Stripped Silver From GDP. Here’s What It Means
- PCE at 3.5%, GDP Miss: Why This Is Bullish for Gold